Research - International Journal of Medical Research & Health Sciences ( 2021) Volume 10, Issue 7
Machine Learning Techniques and Syntactic Pattern Recognition based Heart Disease Prediction for Smart Health
Shawni Dutta1, Payal Bose2, Vishal Goyal3 and Samir Kumar Bandyopadhyay1*2Lincoln University College, Malaysia
3GLA University, Chaumuhan, Uttar Pradesh, India
Samir Kumar Bandyopadhyay, Department of Computer Science, Bhawanipur Education Society College, India, Email: s1954samir@gmail.com
Received: 02-Jun-2021 Accepted Date: Jul 23, 2021 ; Published: 30-Jul-2021, DOI: O
Abstract
Cardiovascular Disease (CVD) may sometimes unexpected loss of life. It affects the heart and blood vessels of the body. CVD plays an important factor in life since it may cause the death of a human. It is necessary to detect early of this disease for secure a patient’s life. In this chapter two exclusively different methods are proposed for the detection of heart disease. The first one is Pattern Recognition Approach with grammatical concepts and the second one is the machine learning approach. In the syntactic pattern recognition approach initially, ECG wave from different leads is decomposed into pattern primitive based on diagnostic criteria. These primitives are then used as terminals of the proposed grammar. Pattern primitives are then input into the grammar. The parsing table is created in a tabular form. It finally indicates the patient with any disease or normal. Here five diseases besides normal are considered. Different Machine Learning (ML) approaches may be used for detecting patients with CVD and assisting health care systems also. These are useful for learning and utilizing the patterns discovered from large databases. It applies to a set of information to recognize underlying relationship patterns from the information set. It is a learning stage. Unknown incoming set of patterns can be tested using these methods. Due to its self-adaptive structure, Deep Learning (DL) can process information with minimal processing time. DL exemplifies the use of the neural network. A predictive model follows DL techniques for analyzing and assessing patients with heart disease. A hybrid approach based on Convolutional Layer and Gated-Recurrent Unit (GRU) is used in the paper for diagnosing heart disease.
Keywords
Machine Learning, Deep Learning, Syntactic Pattern Recognition, Pattern Primitives, Heart Disease
Introduction
The foremost reasons for the high mortality rate over the globe are due to Cardiovascular Disease (CVD). As per World Health Organization (WHO) statistics, nearly 17.7 million people pass away every year in the globe [1,2]. The human heart along with blood vessels is known as the cardiovascular system [3]. Coronary Artery Disease (CAD), heart failure, cardiac arrest, and unexpected cardiac death are due to disorders of the cardiovascular system. It affects humans mostly due to uncontrolled behaviour in their daily life. The interior part of the arteries of the heart consumes fatty deposits or plaque. It is mainly cholesterol deposits within the arteries and it is known as atherosclerosis. These deposits may thicken and cause the coronary arteries to narrow. Due to this the amount of blood and oxygen flows at a reduced rate through the arteries to the heart. The narrowing of the arteries prevents blood and oxygen from flowing easily to the heart muscle. This effect will happen to human as he/she grows ages.
Angina (pain, discomfort, or pressure in the chest) is caused due to these symptoms. If blood flow is completely blocked by plaque or a blood clot that forms inside the narrowed coronary artery, a heart attack may occur. Coronary artery disease symptoms may include weight gain, weakness, and fatigue, etc. of the patient [4].
Based on the above discussion, it can be inferred that Cardiovascular Disease (CVD) plays a significant role in human life. Early detection of this disease is necessary for saving patients’ life. Cardiovascular Disease (CVD) is often dependent on mental anxiety, daily lifestyle, working profile of people. Symptoms of anxiety, depression, and stress may often lead to Cardiovascular Disease (CVD) [5]. For detection of Cardiovascular disease (CVD) uses two heterogeneous approaches such as syntactic pattern recognition based approach and predictive modeling using the deep learning method.
The grammatical approach in the first process is used for cardiac disease diagnosis [6]. In this method, the patient data matrix was constructed initially [6]. It is used for the classification of diseases. Based on diagnosis criteria, pattern primitives are identified. It is obtained from the updated diagnostic criteria published by American Heart Association and also from the medical literature [7]. Based on the patient data matrix, an input string is generated. One of the context-free languages i.e. Chomsky normal form is used to form the production rules for six diseases including Normal. For parsing the input string Cocke-Younger-Kasami (CYK) algorithm is used [6]. In the end, the parsing table will highlight the occurrence of the disease.
In the second approach, an automated predictive model is favored for Cardiovascular Disease (CVD) detection. Early heart disease can be predicted by utilizing supervised machine learning approaches that take the patient’s record as input. To explore the problem of heart disease detection, classification methods are implemented. It associates input variables for finding target classes based on training data. Attributes comprise of patient’s details such as serum, cholesterol, etc. These features can form a good feature space while recognizing patients with cardiac symptoms. The proposed models act to analyze the information of patients about their past health history records and predict their chances of affecting in cardiac trouble. This prediction will in turn benefit the doctors to provide well-versed decisions and prescribe medicines and surgeries accordingly [8].
Using the machine learning approach, heart disease detection is focused in this chapter as one of the approaches. To diagnose Cardiovascular Disease (CVD), it is necessary to extract knowledge from a patient’s health history database and identify the relationship between interfering factors and heart disease probability. The proposed methods capture relevant health records of the patient and discover the tendency of heart disease. Timely detection and screening play a leading role in the prevention of heart attacks. Deep learning (DL) is implemented in this chapter for heart trouble prediction by a means of medical data [9]. Two models are exemplified for this purpose. This paper proposes Recurrent Neural Network (RNN)-based which assembles multiple Long Short Term Memory (LSTM) layers where LSTM is known to be a variation of RNN [10]. This neural network classifier receives all interfering factors as features and identifies patients with heart disease troubles. The second model consists of multiple GRU layers. For finding a superior model a comparative study is drawn among both specified models. Lastly, the best model for Cardiovascular Disease (CVD) classification problem is selected on the comparative study.
Literature Review
Cardiovascular Diseases (CVDs) are the principal reason of mortality worldwide per year that may reach an approximation of 23.6 million in 2030 [11]. The largest contributor to Cardiovascular Diseases (CVDs) is Coronary Heart Disease (CHD). The damage of the arterial wall is the main reason. The leading common indicator of Coronary Heart Disease (CHD) is Myocardial Infarction (MI). Angina pectoris is the former symptom of the pathology for 50% of patients [11]. Immediate diagnosis of Coronary Heart Disease (CHD) patients can save a life. Image processing techniques can help early detection of Coronary Heart Disease (CHD).
For heart disease detection initially, the Electrocardiogram (ECG) is performed. It was started late in the 1950s. The diagnosis of the disease is made by researchers using non-syntactic methods as well as syntactic methods and hybrid methods [6,12]. The syntactic method is used for analysing Electrocardiogram (ECG) patterns. This method is not much used in pattern analysis and a few works have been done to date. Only specific aspects of these areas are looked upon by researchers. For peak recognition in Electrocardiogram (ECG) using Context-free grammar is described in [12].
A pattern in the syntactic approach is considered to have a complex construction, which is decomposed into subpatterns that in turn are decomposed into simpler sub-patterns, etc. In cardiology, an Electrocardiogram (ECG) signal pattern is also treated as a linear structure, which consists of separable substructures describing the different phases of the human heart’s beating (e.g. P wave, T wave, ST segment, QRS complex), A set of various structures is perceived as a formal language. Words (structural patterns) are analyzed by formal automata which not only can identify proper categories (diseases) for patterns, but also can characterize their structural features. Therefore, syntactic pattern recognition seems to be convenient, if a descriptive structural characterization is a goal of Electrocardiogram (ECG) analysis rather than only its classification (i.e. assigning an electrocardiogram signal to one of the classes of heart dysfunction phenomena) [13]. Electrocardiogram (ECG) is often utilized as a common but vital sign from the clinical environment perspective. Analyzing an electrocardiogram often reveals many cardiac disorders.
Existing kinds of literature on automatic electrocardiogram classification are clubbed into different clusters for the review of the classification process. In an ECG-based computer-aided-diagnosis system unwanted information in electrocardiogram waves, parts of electrocardiogram wave detection, heartbeat classification, etc., are necessarily removed for proper diagnosis of disease. Here two approaches are discussed. One is a grammar-based classification of diseases and the other is a machine learning-based hybrid approach for the classification of diseases [14,15].
Machine Learning (ML), a specialized field of Artificial Intelligence (AI), can be used in healthcare that analyses numerous different data points, recommends outcomes, provides well-timed risk scores, defined resource allocation, and delivers many other applications. The opportunities for improving clinical decision support can be made by Machine Learning (ML). Machine Learning (ML) techniques are often related to data mining procedures. From the data mining point of view, Machine Learning (ML) techniques can be said that data mining examines an enormous amount of data and sets a particular outcome based on those examined data. ML focuses on achieving that goal by using harvested data for modeling smart intelligent automated tools. By implementing data mining rules, data related to coronary illness is extracted from a large database. For this purpose, the weighted association was implemented in [16]. Using rule mining algorithms on patients’ datasets, heart disease is predicted. Prediction results achieved 61% training accuracy and 53% testing accuracy.
Historical medical data is utilized to predict Heart Disease using Machine Learning (ML) techniques [17]. 462 instances of the South African Heart Disease dataset used for prediction purposes. All these algorithms used the validation method. It is 10-fold cross-validation. The probabilistic Naive Bayes classifier performed better in comparison to other classifiers [17].
Heart Failure (HF) is classified such as Heart Failure with Preserved Ejection Fraction (HFPEF) and Heart Failure with Reduced Ejection Fraction (HFREF) [18]. Various classification methods are used for detecting patients with heart failure. Several classification methods such as classification trees, random forests, bagged classification trees, boosted classification trees, and Support Vector Machine and for prediction, logistic regression, regression trees, bagged regression trees, random forests, and boosted regression trees are utilized for detecting patients with aforementioned three categories of heart failure. These are tree-based methods and regression trees for predicting and classifying HF subtypes.
K. Gomathi, et al. predicted heart disease using Naive Bayes Classifier and J48 classifier [19]. They have concluded that the Naive Bayes classifier reaches an accuracy of 79% where the J48 classifier reaches an accuracy of 77%. P. Sai Chandrasekhar Reddy, et al. used Artificial Neural Network (ANN) for predicting Heart disease by considering relevant features such as heart rate, blood pressure, etc. [20]. Boshra Brahmi, et al. employed several classification techniques such as J48, K-Nearest Neighbour (KNN), SMO, and Naive Bayes for diagnosing heart disease [21]. Instead of focusing on feature selection, emphasis is given to all relevant features for heart disease diagnosis and prediction [22]. This prediction modeling is implemented by assembling Random Forest with a linear model. Another study considered Arrhythmia which is irregular changes of normal heart rhythm as a prediction field [23]. Arrhythmia prediction is accompanied by implementing Convolution Neural Network (CNN) which accepts ECG signals as input.
Datasets
Datasets having ECG waves are collected from hospitals of West Bengal. The middle-aged people with the range from 40 to 70 are considered. Others are taken from the American Heart Association [12].
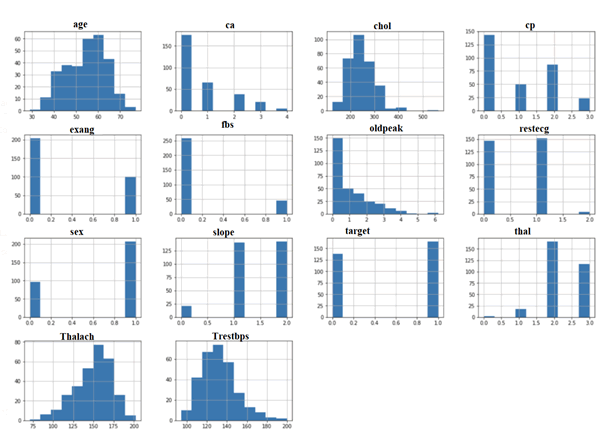
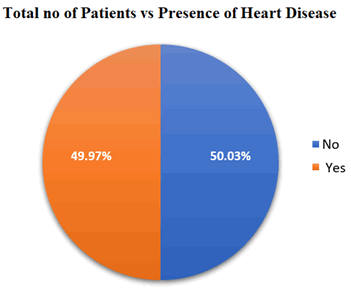
This study implements a deep learning-based study for implementing computer-aided classification. UCI machine learning repository is used for predicting the cardiac disorder of a patient. Various attributes are in the dataset [24]. However, the attribute ‘target’ is utilized as the output class of the prediction. Figure 1 presents the overall histogram representation of the dataset. For obtaining a balanced dataset, pre-processing techniques are performed. After collecting the dataset some pre-processing techniques such as Not a Number (NaN) values handling, scaling, and transformation of some attributes such as age, cholesterol level, etc. are performed. This will assist the classifier in obtaining better predictive results. This pre-processed data is divided into 67:33 as training and testing datasets. Training data is given as input to the classifier model for the learning process and after that testing; the dataset is used for obtaining prediction results. The distribution of cardiac and non-cardiac patients on the dataset is shown in Figure 1, Figure 2, and Table 1.
| Attribute (Explanation) | Attribute Type | Values |
|---|---|---|
| Age | Numeric | 40-70 |
| Sex | Categorical | 0-female, 1-male |
| CP (Chest Pain) | Categorical | 0: asymptomatic, |
| 1: atypical angina, | ||
| 2: non-anginal pain, | ||
| 3: typical angina | ||
| Trestbps (The patients’ resting blood pressure of the patient during the admission time; measured in the unit of mm Hg) | Numeric | 94-200 |
| Chol: Measurement of cholesterol in mg/dl | Numeric | 126-564 |
| fbs: fasting blood sugar of the patient measured in mg/dl | Binary | (if fbs>120 mg/dl, |
| 1= true; otherwise 0=false) | ||
| restecg: indicates the resting electrocardiographic outcomes | Categorical | 0:indicatespossibility of left ventricular hypertrophy using Estes’ criteria |
| 1: normal | ||
| Two having ST-T wave abnormality (T wave inversions and/or ST elevation or depression of >0.05 mV) | ||
| thalach: highest heart rate observed | Numeric | 71-202 |
| exang: Exercise-induced angina | Categorical | 0: no |
| 1: yes | ||
| Oldpeak: ST depression induced by exercise relative to rest | Numeric | 0.0-6.2 |
| ST segment slope | Categorical | It varies from 0 to 2 depending on down, flat, and up sloping |
| ca: quantity of major vessels | Categorical | 01-Apr |
| Thalassemia (thal) | Categorical | Zero: indicates NULL (no Thalassemia) |
| One: indicates fixed defect as some portion | ||
| Two: Normal blood flow is denoted by two | ||
| Three: Abnormal blood flow is observed | ||
| Presence of Heart disease (target) | Binary | 1/0 or yes/no |
Proposed Methods
Proposed Method 1: Pattern Recognition with Syntactic Recognition based Approach
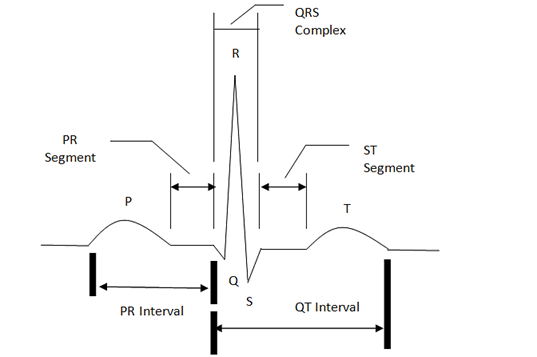
While detecting coronary artery disease, contaminated recordings create a major problem. So, pre-processing steps are highly recommended before processing ECG waves. For removing noise low-pass filter as well as a high-pass filter is used. For power source interference 50 Hz notch filter is used. Figure 3 shows a normal ECG wave. The ECG wave is taken through 12 lead systems. Six electrodes art placed on the limbs. On chest six are placed.
Figure 3. Normal ECG waveform and its feature patterns [25]
P, Q, R, S, and T waves are called the PQRST complex. “R-R interval”, corresponds to a cardiac cycle. The following parameters are also used for the diagnosis of heart disease from ECG Wave.
1. The end of the P wave to the beginning of the Q wave is denoted by the PR interval. The starting of P to the end of Q is specified as the PQ interval. The horizontal portion from the end of the P wave to the beginning of the Q wave is known as the PR segment. The depolarization wave is identified by this segment
2. The end of the S wave to the start of the T wave is the ST segment
3. The staring of Q wave to the end of T wave is called QT interval [25]
The syntactic methods of pattern recognition for cardiac diseases diagnosis are the main aim of the first approach [6]. Initially for generating the grammar in the Cocke-Younger-Kasami algorithm (CYK) normal form patient data matrix is used. The grammar is context-free since there is no dependency on consecutive pattern primitives. These primitives are treated as terminals of the grammar. Non-terminals are created based on the terminals for the classification of heart diseases. Here pattern primitives are terminals of the grammar. The updated diagnostic criteria published by the American Heart Association and from a review of the medical pieces of literature are used as diagnostic criteria [14,15]. The initial string is based on the patterns primitives and patient data matrix. It is always required that the input string is parsed by the Production Rules of the grammar. Production rules of grammar are generated using terminals and nonterminals of the grammar. Production rules are in the form of CYK’s normal form. It is as per the definition of contextfree language and it is developed by using diagnostic rules for describing five cardiac diseases besides the normal ECG. The CYK algorithm is used to parse the input string [6]. If the patient’s ECG has a sign of any abnormalities, then the first column at the top of the parsing table will show the disease. Right and left bundle branch block, left ventricular hypertrophy, left-anterior hemiblock, and left atrial hypertrophy-hereafter abbreviated to RBBB, LBBB, LVH, LAN, and LAHI are chosen as the five diseases. Normal ECG wave is considered as six one for classification of disease. Four different areas of the ventricles are taken since these represent one of the vital parts of the heart. Left atrial hypertrophy is considered since it is common. It is aimed here for diagnosing a patient with a normal symptom or abnormal symptom. For simplicity, the five diseases are denoted as D1, D2, D3, D4, and D5. The selection of primitive selection is both problem-oriented and pattern-dependent. There is no general solution to this problem as yet [12]. The diseases and abnormal findings are identified as a relationship for forming decisions regarding patterns and it is then transformed into pattern primitives. The patient data matrix is checked against Diagnostic criteria and the patient data matrix are checked and transformed into binary decision i.e. satisfied primitive and unsatisfied primitives. Either of the two types is based on whether the particular condition is satisfied or not. A set of ten primitives in terms of notations A1, A2, B, C, and D have been selected for the five diseases.
D1:
(A1) The Amplitude of R wave (AR), the amplitude of S wave (AS), and amplitude of R’ wave, of each complex is greater than 6 mm in lead V1 or V2. Also, the width of R’ (DR) is greater than 0.025 s in lead V1 or V2.
(A2) Ventricular activation time (TVA) is greater than 0.44s in V1 or V2.
(B) Duration of S wave (DS) in lead I is greater than or equal to 0.03 s.
(C) QRS duration (TQRS) is greater than 0.12 s.
D2:
(A) QRS duration (TQRS) is greater than 0.12 s.
(B) AR, AS and AR each complex is greater than 6 mm in at least one of the leads I,
AVL, V5, and V6 or notched R wave (i.e. the duration of R wave is greater than 044 s) present in at least one of the leads I, AVL, V5, or V6.
D3:
(A1) AR is greater than 27 mm in lead V5 or V6.
(A2) Q wave amplitude AQ or AS in lead V1 plus AR in lead V5 or V6 is greater than or equal to 35 mm.
(A3) AR is greater than or equal to 13 mm in lead AVL.
(A4) AR in lead I plus AS in lead I11 is greater than or equal to 26 mm.
(B) Patient’s age is above 30 years.
D4:
(A) Left-Axis Deviation (LAD) is between -45” and -60”.
(B) Q wave duration is less than or equal to 0.02 s in lead I and AVL.
(C) A is less than 5 mm in leads I, 11,111, and AVF.
(D) Normal QRS duration (pure LAH can increase the QRS duration by no more than 0.02 s, thus a QRS duration of 0.11 s indicates the coexistence of RBBB or some other form of ventricular conduction abnormality).
D5:
(A1) Notched P wave amplitude (AP) and P’ wave amplitude (AP) is greater than 1 mm in leads I, I1, or AVL.
(A2) AP is greater than 3 mm in lead I or in lead AVL or equal to 3.5 mm in lead 11.
(B) Overall P wave duration (DP) is greater than 0.11 s.
Considering the diagnostic criteria as specified above the pattern primitives are selected based on whether the diagnostic criteria are satisfied or not. This is shown in Table 2.
| Disease Name (1) | Diagnostic Criteria (2) | The notation used for ‘satisfied’ primitives (3) | The notation used for ‘unsatisfied’ primitives (4) |
|---|---|---|---|
| Right Bundle Branch Block (RBBB) | (A1) | B | M |
| (A2) | b | m | |
| (B) | b | m | |
| (C) | b | m | |
| Left Bundle Branch Block (LBBB) | (A) | c | k |
| (B) | c | k | |
| Left Ventricular Hypertrophy (LVH) | (A1) | e | l |
| (A2) | e | l | |
| (A3) | e | l | |
| (A4) | e | l | |
| (B) | e | l | |
| Left Anterior Hemiblock (LAH) | (A) | h | j |
| (B) | h | j | |
| (C) | h | j | |
| (D) | h | j | |
| Left Anterior Hemiblock group 1 (LAH1) | (A1) | A | N |
| (A2) | a | n | |
| (B) | a | n |
An input string is generated based on the diagnostic pattern primitives. This input string defines the complete characterization of the disease structure taken into consideration. This representation will produce a disease pattern that comprises basic elements that are related to the disease present in the input ECG wave. The string generation algorithm is described below.
Algorithm
Input: Patient data matrix.
Output: A string Z of symbols is formed by the alphabet set={a, b, c, e, h, j, k, I, m, n}. The symbols indicate pattern primitives either ‘satisfied’ or ‘unsatisfied’ condition for the considered disease.
Step 1. Assign p=1.
Step 2. Assign q=1.
Step 3. If the condition ‘q’ for the disease p is satisfied, then consider zp=satisfied primitive and go to Step 5.
Step 4. Set zp=unsatisfied primitive.
Step 5. If q is greater than the total number of criteria in disease p, then go to Step 7
Step 6. Set q=q+1 and go to Step 3.
Step 7. Now concatenate zp with zp-1, to form the complete string z.
Step 8. If p is greater than the total number of considered diseases, then continue, otherwise set p=p+1 and go to Step 2.
Step 9. Exit.
Assume that the sample electrocardiogram is retrieved from a 58-year-old male patient. It has already been processed by using the described algorithm and this will yield the patient data matrix which is presented in Table 3. To shorten the discussion, we denote the following partial information from Figure 4.
| Parameters | I | II | III | AVR | AVL | AVF | V1 | V2 | V3 | V4 | V5 | V6 |
|---|---|---|---|---|---|---|---|---|---|---|---|---|
| PA | 2 | 2 | -2 | -1 | 1 | 1 | -1 | 2 | 2 | 1 | 1 | 1 |
| PD | 0.12 | 0.12 | 0.11 | 0.12 | 0.12 | 0.12 | 0.12 | 0.12 | 0.12 | 0.12 | 0.12 | 0.12 |
| P`A | 0 | 0 | 0 | 0 | 0 | 0 | 0 | 0 | 0 | 0 | 0 | 0 |
| P`D | 0 | 0 | 0 | 0 | 0 | 0 | 0 | 0 | 0 | 0 | 0 | 0 |
| QA | -1 | -1 | 0 | 0 | 0 | -1 | 0 | 0 | 0 | -2 | -2 | -2 |
| QD | 0.02 | 0.02 | 0 | 0 | 0 | 0.02 | 0 | 0 | 0 | 0.02 | 0.02 | 0.02 |
| RA | 20 | 11 | 0 | 0 | 17 | 3 | 0 | 3 | 3 | 40 | 40 | 40 |
| RD | 0.08 | 0.09 | 0 | 0 | 0.01 | 0.05 | 0 | 0.02 | 0.02 | 0.08 | 0.08 | 0.08 |
| R`A | 0 | 0 | 0 | 0 | 0 | 0 | 0 | 0 | 0 | 0 | 0 | 0 |
| R`D | 0 | 0 | 0 | 0 | 0 | 0 | 0 | 0 | 0 | 0 | 0 | 0 |
| SA | -2 | 0 | -15 | -18 | 0 | -11 | -37 | -22 | -22 | -12 | -12 | -12 |
| SD | 0.02 | 0 | 0.11 | 0.12 | 0 | 0.06 | 0.12 | 0.1 | 0.1 | 0.02 | 0.02 | 0.02 |
| S`A | 0 | 0 | 0 | 0 | 0 | 0 | 0 | 0 | 0 | 0 | 0 | 0 |
| S`D | 0 | 0 | 0 | 0 | 0 | 0 | 0 | 0 | 0 | 0 | 0 | 0 |
| TA | 2 | 3 | 1 | -3 | -3 | 2 | -7 | 6 | 6 | 8 | 8 | 8 |
| TD | 0.12 | 0.12 | 0.11 | 0.12 | 0.12 | 0.12 | 0.12 | 0.12 | 0.12 | 0.12 | 0.12 | 0.12 |
| VAT | 0.06 | 0.06 | 0 | 0 | 0.07 | 0.04 | 0 | 0.01 | 0.01 | 0.07 | 0.07 | 0.07 |
| PR | 0.16 | 0.16 | 0.14 | 0.16 | 0.16 | 0.16 | 0.16 | 0.16 | 0.16 | 0.16 | 0.16 | 0.16 |
| QT | 0.28 | 0.28 | 0.25 | 0.28 | 0.28 | 0.28 | 0.28 | 0.28 | 0.28 | 0.28 | 0.28 | 0.28 |
| ST | 0.05 | 0.06 | 0.04 | 0.04 | 0.04 | 0.04 | 0.04 | 0.04 | 0.04 | 0.04 | 0.04 | 0.04 |
| QRS | 0.11 | 0.1 | 0.11 | 0.12 | 0.11 | 0.12 | 0.12 | 0.12 | 0.12 | 0.12 | 0.12 | 0.12 |
| S-TON | 0 | 0 | 0 | 0 | 0 | 0 | 0 | 0 | 0 | 0 | 0 | 0 |
| 58 AGE | -21.00 AXIS | 5 HEART RATE |
After collecting the above information, we obtained the following string using Table 2.
m m m m……
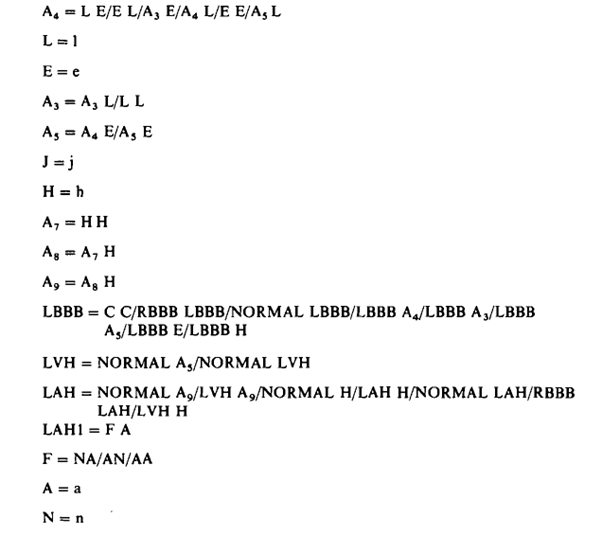
After the string generation operation is completed, the immediate task to be accomplished is to specify diseases by a means of syntax analysis. The proficiency of a syntax analyzer is dependent mainly on the grammar that generates the language and also depends on the parser that evaluates the syntactic correctness of an input string. To describe the considered normal and disease patterns, Context-free language in Chomsky normal form has been utilized. The names of the diseases with other symbols are taken as non-terminals. The names used for such non-terminals are the same as those used in conventional ECG nomenclature so that they can be easily understood. The diagnosis grammar describing the normal as well as the five disease patterns is given in Figure 5. The production rules are prepared based on [6].
The production rules are in the meta language BNF (Backus Normal Form). Many variants of BNF are in use. WSN (Wirth Syntax Notation) is used for convenience [26]. It is important to know whether the string belongs to L G Diagnosis or not.
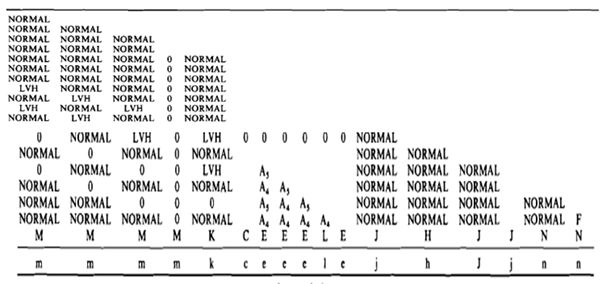
The proposed method uses the Cocke-Younger-Kasami (C-Y-K) bottom-up parsing algorithm and it produces a structured table. The tabular form is well suited for physicians to have a quick look at the condition of the patient. The patient data matrix is now validated against diagnostic criteria and a string comprising of primitives is formed. Suppose the input string is composed of the following:
x= m4 k c e3I e j 2 n 2 a
‘m’ means single occurrence and ‘m2represents the occurrence of primitive m twice and so on. Figure 6 shows the parsing table. It indicates the disease or normal as per convention used in the conventional parsing table. The occurrence of diseases is investigated on inspection of the first column and particular location namely the third row, (total number of diagnostic criteria present in N-number of diseases-the number of criteria present in LAHI) plus one of the parsing table. ‘NORMAL’ indicates the left atrial hypertrophy diseases are not present in the disease pattern. The presence of any disease may occur more than once in the first column. It is the basis of the parsing table that the final diagnostic report is made by merging those diseases into one. It is declared ‘NORMAL’ since the top row of the first column of the parsing table contain none of the considered diseases.
Proposed Method 2: Deep Learning-based method
Deep Learning (DL) is a specialized area of Machine Learning (ML) that enforces automatic learning of abstract information from a large database without incorporating manual feature engineering methods. Deep neural networks are capable to compute complex functions by extracting features from input data. These computations are dependent on several hidden layers and other parameters. For accompanying the complex computations, activation functions are used. Activation functions are advantageous in executing complicated computations and associates input signals into output signals within a certain range [27-33].
Long Short-Term Memory (LSTM) neural network is a category of RNN that performs context-based prediction which is not taken care of by traditional RNN. LSTM is efficient in regulating gradient flow and better preservation of long-range dependencies. Every cell in LSTM is comprised of an input gate, forget gate, and output gate. The use of input gate estimates when to remember input value, and when to remember or forget the value is determined by forget gate. The output gate identifies when the unit should output the value in its memory [10]. A similar concept is employed by Gated Recurrent Unit (GRU). But as compared to LSTM, GRU receives a fewer number of parameters.
Over-fitting is a serious problem that is faced mostly by neural network-based models. This problem occurs when a model learns noise present in the training data which in turn negatively impacts the efficiency of the model on unknown data. This problem can be eliminated by incorporating dropout layers. During each of the training iterations, the dropout layer randomly deactivates a fraction of the units or connections in a network [34]. Once the neural model is configured, it undergoes a training process. The training process is executed through one cycle which is known as an epoch. In an epoch, the dataset is partitioned into smaller sections. For completing the execution of each epoch, an iterative process is carried out by a means of the batch size that considers subsections of the training dataset for completing epoch execution [35]. The training process is also accompanied by a training criterion, known as binary cross-entropy function as a binary classification problem is implemented in this study. Binary cross entropy finds out the difference between the true value (which is either 0 or 1) and the prediction for each of the classes and then class errors are averaged out to measure the final loss [36].
Any machine learning models depend on some predefined metrics such as accuracy, precision, recall, f1-score, MSE, and cohen-kappa statistics. These metrics help in identifying the best problem-solving tactic. Accuracy determines the percentage of true predictions over the whole number of instances considered [37]. However, accuracy evaluation may not be enough since it does not reflect wrong predicted cases. For resolving the above-mentioned problem, two more metrics are known as Recall and Precision can be yielded. Precision ascertains the fraction of correct positive results over the number of positive results predicted by the classifier [37]. The number of correct positive results divided by the number of all relevant samples is measured by recall [37]. F1-Score or F-measure is another parameter that is the harmonic mean of both precision and recall [37]. Mean Squared Error (MSE) is another evaluating metric that can differentiate the prediction observation from actual observation of the test samples [37]. A model having higher values of accuracy, F1-Score, and lower MSE value indicates the best problem-solving technique. Cohen-Kappa Score is a statistical parameter that discovers inter-rate agreement for qualitative items for classification techniques [38].
The objective of any classifier model is to map input variables into target variables considering the training dataset. The proposed classifier employs deep learning techniques to recognize whether a patient has heart disease or not. The proposed method uses the LSTM-BRNN model for such prediction. A stacked LSTM-BRNN model is implemented as the second approach that stacks four Bidirectional LSTM layers and four dense layers. This stacked LSTM-BRNN model is built up using 256, 128, 64, 16 nodes respectively in every single layer. To avoid the over-fitting problem, each layer is incorporated with 20% of dropout regularization. Next, four fully connected layers are stacked by including 8,4,2,1 number nodes respectively. The first four Long Short-Term Memory (LSTM) layers and the final dense layers are activated using the sigmoid activation function. Finally, the above-mentioned layers are assembled using an “adam” optimizer. This model is accompanied by a binary cross-entropy loss function. The construction of this model is dependent on epoch size of 100 and batch size of 32. The mentioned hyper-parameters have undergone a series of possible values and the mentioned values are picked up. This fine-tuning operation will support in attaining the best problem-solving approach. Once this model is constructed, training data is fitted into the proposed model. During the training phase, the presented neural network model accepts a total of trainable 1,367,993 parameters to retrieve prediction. An in-depth description in terms of layers, type of layers, activation function used, output shape produced by each layer, number of parameters accepted by each layer is summarized in Table 4. The proposed model consists of a total of 12 layers, out of which 4 layers are of LSTM neural network.
The same configuration is used by the stacked bi-directional GRU model. Table 5 describes the detailed construction of the second model. Description of all the hyper-parameters for Stacked Bidirectional LSTM model as well as Stacked Bidirectional GRU model is summarized in Table 4 and Table 5 respectively.
| Layer | Number of Nodes/Percentage Rate | Output Shape | Number of Parameters Received | Activation function Used |
|---|---|---|---|---|
| Bidirectional LSTM layer | 256 | (None, 30, 512) | 528384 | Sigmoid |
| Dropout Layer | 20% | (None, 30, 512) | 0 | None |
| Bidirectional LSTM layer | 128 | (None, 30, 256) | 656384 | Sigmoid |
| Dropout Layer | 20% | (None, 30, 256) | 0 | None |
| Bidirectional LSTM layer | 64 | (None, 30, 128) | 164352 | Sigmoid |
| Dropout Layer | 20% | (None, 30, 128) | 0 | None |
| Bidirectional LSTM layer | 16 | (None, 32) | 18560 | Sigmoid |
| Dropout Layer | 20% | (None, 32) | 0 | None |
| Dense layer | 8 | (None, 8) | 264 | None |
| Dense layer | 4 | (None, 4) | 36 | None |
| Dense layer | 2 | (None, 2) | 10 | None |
| Dense layer | 1 | (None, 1) | 1 | Sigmoid |
| Layer | Number of Nodes/Percentage Rate | Output Shape Obtained from each layer | Number of Parameters Received | Activation function Used |
|---|---|---|---|---|
| Bidirectional GRU layer | 256 | (None, 30, 512) | 508384 | Sigmoid |
| Dropout Layer | 20% | (None, 30, 512) | 0 | None |
| Bidirectional GRU layer | 128 | (None, 30, 256) | 553394 | Sigmoid |
| Dropout Layer | 20% | (None, 30, 256) | 0 | None |
| Bidirectional GRU layer | 64 | (None, 30, 128) | 124852 | Sigmoid |
| Dropout Layer | 20% | (None, 30, 128) | 0 | None |
| Bidirectional GRU layer | 16 | (None, 32) | 17690 | Sigmoid |
| Dropout Layer | 20% | (None, 32) | 0 | None |
| Dense layer | 8 | (None, 8) | 249 | None |
| Dense layer | 4 | (None, 4) | 34 | None |
| Dense layer | 2 | (None, 2) | 9 | None |
| Dense layer | 1 | (None, 1) | 1 | Sigmoid |
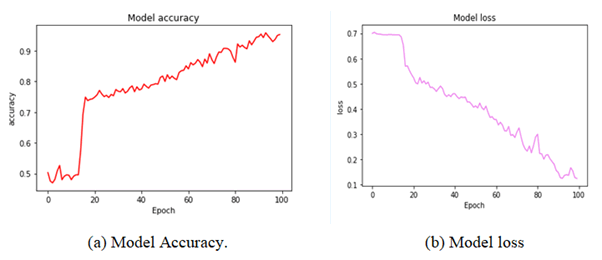
During the training process of the stacked bi-directional LSTM model, accuracy and loss are calculated for each epoch as depicted in Figure 7. As the quantity of epochs grows, the accuracy increases gradually and reaches around a value of 0.95. In contrast, the loss gradually decreases and attains the lowest value around 0.12. Once the training process is done i.e., after completing 100 epochs, accuracy, f1-score, cohen-kappa score, and MSE rate for unlabelled dataset. Table 6 provides the prediction efficiency for the presented model. It is to be noted that the proposed stacked bi-directional LSTM model has 4 LSTM layers. In Table 7 it is also shown as the model efficiency is increased over 1, 2, and 3 LSTM layers. Increasing more than 4 LSTM layers is not enhancing much substantial efficiency. Hence it is restricted to have 4 LSTM layers as a model component.
| Hyper-parameters Used | Values |
|---|---|
| Number of Epochs | 100 |
| Optimizer Used | Adam |
| Loss Function | Cross-Entropy |
| Batch Size | 64 |
| Hyper-parameters Used | Values |
|---|---|
| Number of Epochs | 50 |
| Optimizer Used | Adam |
| Loss Function | Cross-Entropy |
| Batch Size | 32 |
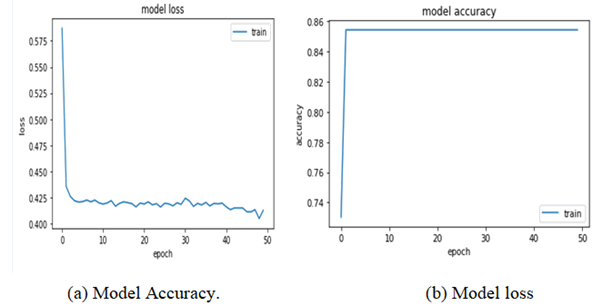
As shown in Figure 8, the Stacked Bidirectional GRU model is trained for 50 epochs. Increasing the number of epochs to more than 50 is not contributing to the efficiency of the model. Hence, it is restricted to 50 epoch size. The training loss declines rapidly within 10 epochs and later decreases gradually as the number of epoch’s increases. After 50 to epoch, it approaches a loss of 0.394. During training, this model starts from obtaining a lower value accuracy which is increased to 0.8542 after certain epochs. Table 8 provides the performance of prediction for the proposed GRU-based model. A comparative study among the 1, 2, 3, and 4 GRU layers is also described in Table 9.
| Number of Layer Used | Accuracy | Cohen-Kappa Score | F1-Score | MSE |
|---|---|---|---|---|
| 4 | 93.22% | 0.87 | 0.93 | 0.07 |
| 3 | 91.32% | 0.85 | 0.91 | 0.0897 |
| 2 | 90.22% | 0.82 | 0.9 | 0.092 |
| 1 | 89.72% | 0.798 | 0.89 | 0.095 |
| Number of Layer Used | Accuracy | Cohen-Kappa Score | F1-Score | MSE |
|---|---|---|---|---|
| 4 | 84.37% | 0.78 | 0.84 | 0.15 |
| 3 | 81.72% | 0.76 | 0.82 | 0.178 |
| 2 | 80.60% | 0.75 | 0.81 | 0.19 |
| 1 | 79.72% | 0.73 | 0.8 | 0.298 |
As shown in table 8 and table 9, it is clear that the stacked bidirectional GRU model does not show as promising efficiency as that of the stacked bidirectional LSTM model. Hence, this model can be regarded as the best one for pursuing the CVD classification problem. Early prediction of heart disease may increase the life span of the heart patient due to arise anxiety for numerous reasons. Considering the past health record of a patient, the proposed Stacked Bidirectional LSTM Model can predict cardiac disease probabilities efficiently. This will assist the medical care units as well as accompany the doctors so that countermeasures such as surgeries, medicines can be suggested. This proposed method reaches a promising and significant result that is dedicated to heart disease prediction. Experimental results have shown prediction accuracy of 93.22%, and F1-score of 0.93, kappa score of 0.87 with an MSE of 0.07.
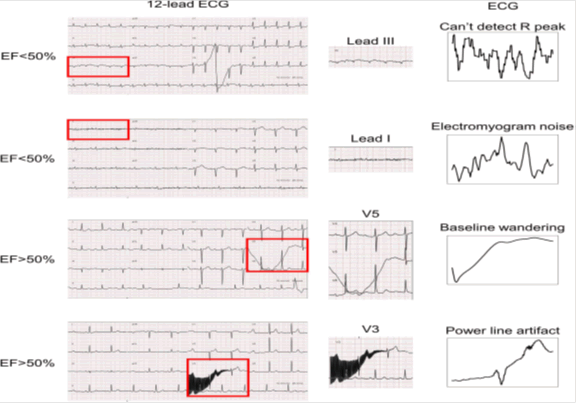
It is important to note that the following types of noises are considered in the ECG wave. It is shown in Figure 9.
The following table 10 will show types of cardiovascular diseases with symptoms, cause, and prevention methods [39].
| CVD Type | Symptoms | Cause | Prevention Methods |
|---|---|---|---|
| Heart Attack | Discomfort, Indigestion, Sweating, Vomiting, Irregular, heartbeats. | Artery Plaque Attributable to calcium, fatty halter, proteins, and cells that are inflammatory. | Narcotics (aspirin, brilinta, etc.) surgical procedure Processes-Angioplasty |
| Coronary Heart Disease | Chest pain, Aching, Heaviness | Pulmonary embolism, Cardiomyopathy, Pericarditis, | Angioplasty, Bypass surgery |
| Ischemic stroke | Headache, Paralysis, Facial numbness, leg, and trouble walking | Blocked artery hemorrhagic stroke | Carotid Endarterectomy angioplasty |
| Arrhythmia | Palpitations, fainting, dizziness, weakness, and fatigue | Electrolyte Incorrect Balance in the blood, muscle changes in the heart | Medication, Change lifestyle, and surgery. |
| Heart Valve Disease | Swelling of the feet, ankles, or abdomen trouble with breathing, and rapid gain in weight | Acquired valve disease, Congenital valve disease, Rheumatic fever | Medication, brush carefully to prevent teeth and gums infection |
| Enlarged Heart (Cardiomegaly) | Shortness of breath, weight gain, fatigue, and leg swelling | Genetic and inherited conditions, infection of HIV, abnormal heart valve, high blood pressure | Cardiac catheterization, high blood regulation. Avoiding the Usage of harmful alcohol substances and caffeine |
| Heart Murmurs | High Blood Pressure and Anemia | Fever and hyperactive thyroid | Prevents of blood clots surgery and diuretics Through medicines |
| Cardiac Arrest | Racing Heartbeat, Dizziness | Abnormal Heart Rhythms (Arrhythmia) | Consistently following-up with the doctors, surgery, and Medication |
Limitation of Study
The paper focused on CVD in the human heart by two methods. The first method that is syntactic approach is used where different conditions of heart diseases are considered for writing the syntactic rules. This study is made based on consultations with doctors. Naturally, all the possibilities for writing production rules are not considered. This is the main limitation of the first method. In the second method, method is based on machine learning. It is known that machine learning depends on the dataset. It is not true that the dataset used here is complete for the detection of heart disease. So limitation lies in considering insufficient datasets collected from the available dataset on the internet and collecting datasets from hospitals.
Conclusion
Healthcare shows a significant key for perceiving the health-related aspects of humans around the globe. This chapter focuses on identifying CVDs in the human heart from two perspectives. These two approaches cover syntactical patterns discover from ECG reports as well as the construction of predictive modelling using deep learning techniques. The pattern discovery approach is an interesting domain yet challenging to perform because of its dependency on formal language generation. The predictive modelling is based on a deep neural network. Multiple neural networks are utilized as the second approach. The use of neural networks requires to be exemplified as it simulates human brain-like tasks. The construction of an intelligent computerized tool is favoured in this study as it facilitates the CVD classification task. Separating the CVD patients may assist the medical care unit to put more attention to their treatment. This task will benefit the clinicians to assist in making informed decisions.
Declarations
Conflicts of Interest
The authors declared no potential conflicts of interest concerning the research, authorship, and/or publication of this article.
References
- Pagidipati, Neha Jadeja, and Thomas A. Gaziano. "Estimating deaths from cardiovascular disease: A review of global methodologies of mortality measurement." Circulation, Vol. 127, No. 6, 2013, pp. 749-56.
- Murray, Christopher JL, et al. "Using verbal autopsy to measure causes of death: The comparative performance of existing methods." BMC Medicine, Vol. 12, No. 1, 2014, pp. 1-19.
- Buckberg, Gerald D., et al. "What is the heart? Anatomy, function, pathophysiology, and misconceptions." Journal of Cardiovascular Development and Disease, Vol. 5, No. 2, 2018, p. 33.
- Mall, Franklin P. "On the development of the human heart." American Journal of Anatomy, Vol. 13, No. 3, 1912, pp. 249-98.
- Rajkumar, Ravi Philip. "COVID-19 and mental health: A review of the existing literature." Asian Journal of Psychiatry, Vol. 52, 2020, p. 102066.
- Gonzalez, Rafael C., and Michael G. Thomason. "Syntactic pattern recognition: An introduction." 1978.
- Stewart, Jack, Gavin Manmathan, and Peter Wilkinson. "Primary prevention of cardiovascular disease: A review of contemporary guidance and literature." JRSM Cardiovascular Disease, Vol. 6, 2017, pp. 1-9.
- Bandyopadhyay, Samir Kumar, and Shawni Dutta. "Stacked bi-directional lstm layer based model for prediction of possible heart disease during lockdown period of Covid-19: Bidirectional LSTM." Journal of Advanced Research in Medical Science & Technology, Vol. 7, No. 2, 2020, pp. 10-14.
- Costa-jussà, Marta R., et al. "Introduction to the special issue on deep learning approaches for machine translation." Computer Speech & Language, Vol. 46, 2017, pp. 367-73.
- Yu, Yong, et al. "A review of recurrent neural networks: LSTM cells and network architectures." Neural Computation, Vol. 31, No. 7, 2019, pp. 1235-70.
- Wang, Zhuo, et al. "Death burden of high systolic blood pressure in Sichuan Southwest China 1990-2030." BMC Public Health, Vol. 20, No. 1, 2020, pp. 1-9.
- Udupa, Jayaram K., and Ivaturi SN Murthy. "Syntactic approach to ECG rhythm analysis." IEEE Transactions on Biomedical Engineering, Vol. 7, 1980, pp. 370-75.
- Albus, John Edward, et al. "Syntactic pattern recognition, applications." Vol. 14, Springer Science & Business Media, 2012.
- Goldschager, N., and Mervin J. Goldman. "Principles of clinical electrocardiography." Lange Medical Publications, 1989.
- Arzbaecher, Robert. "Computer Techniques in Cardiology, edited by LD Cady, Jr." Medical Physics, Vol. 7, No. 4, 1980, p. 395.
- Chauhan, Aakash, et al. "Heart disease prediction using evolutionary rule learning." 2018 4th International Conference on Computational Intelligence & Communication Technology (CICT). IEEE, 2018.
- Gonsalves, Amanda H., et al. "Prediction of coronary heart disease using machine learning: An experimental analysis." Proceedings of the 2019 3rd International Conference on Deep Learning Technologies, 2019.
- Austin, Peter C., et al. "Using methods from the data-mining and machine-learning literature for disease classification and prediction: A case study examining classification of heart failure subtypes." Journal of Clinical Epidemiology, Vol. 66, No. 4, 2013, pp. 398-407.
- Kirmani, Mudasir M. "Cardiovascular disease prediction using data mining techniques: A review." Oriental Journal of Computer Science & Technology, Vol. 10, No. 2, 2017, pp. 520-28.
- Reddy, Mr P. Sai Chandrasekhar, Mr Puneet Palagi, and S. Jaya. "Heart disease prediction using ann algorithm in data mining." International Journal of Computer Science and Mobile Computing, Vol. 6, No. 4, 2017, pp. 168-72.
- Bahrami, Boshra, and Mirsaeid Hosseini Shirvani. "Prediction and diagnosis of heart disease by data mining techniques." Journal of Multidisciplinary Engineering Science and Technology (JMEST), Vol. 2, No. 2, 2015, pp. 164-68.
- Mohan, Senthilkumar, Chandrasegar Thirumalai, and Gautam Srivastava. "Effective heart disease prediction using hybrid machine learning techniques." IEEE Access, Vol. 7, 2019, pp. 81542-54.
- Izci, Elif, et al. "Cardiac arrhythmia detection from 2d ecg images by using deep learning technique." 2019 Medical Technologies Congress (TIPTEKNO), IEEE, 2019.
- Keogh, Eammon, C. Blake, and Chris J. Merz. "UCI repository of machine learning databases." Irvine, CA: Uni of California, Department of Information and Computer Science, 1998.
- Vijayavanan, M., V. Rathikarani, and P. Dhanalakshmi. "Automatic classification of ECG signal for heart disease diagnosis using morphological features." International Journal of Computer Science & Engineering Technology, Vol. 5, No. 4, 2014, pp. 449-55.
- Shu, Ting, Bob Zhang, and Yuan Yan Tang. "Effective heart disease detection based on quantitative computerized traditional chinese medicine using representation based classifiers." Evidence-Based Complementary and Alternative Medicine, Vol. 2017, 2017.
- Karlik, Bekir, and A. Vehbi Olgac. "Performance analysis of various activation functions in generalized MLP architectures of neural networks." International Journal of Artificial Intelligence and Expert Systems, Vol. 1, No. 4, 2011, pp. 111-22.
- Hu, Shengshou, et al. "Summary of the 2018 report on cardiovascular diseases in China." Chinese Journal of Circulation, Vol. 34, No. 3, 2019, pp. 209-20.
- Ping, Yongjie, et al. "Automatic detection of atrial fibrillation based on CNN-LSTM and shortcut connection." Healthcare, Vol. 8, No. 2, 2020.
- Wu, Qing, et al. "ECG signal classification with binarized convolutional neural network." Computers in Biology and Medicine, Vol. 121, 2020, p. 103800.
- Ma, Fengying, et al. "An automatic system for atrial fibrillation by using a CNN-LSTM Model." Discrete Dynamics in Nature and Society, Vol. 2020, 2020.
- Sangaiah, Arun Kumar, Maheswari Arumugam, and Gui-Bin Bian. "An intelligent learning approach for improving ECG signal classification and arrhythmia analysis." Artificial Intelligence in Medicine, Vol. 103, 2020, p. 101788.
- Park, Junsang, et al. "ECG-signal multi-classification model based on squeeze-and-excitation residual neural networks." Applied Sciences, Vol. 10, No. 18, 2020, p. 6495.
- Srivastava, Nitish. "Improving neural networks with dropout." University of Toronto, Vol. 182, No. 566, 2013, p. 7.
- Kline, Douglas M., and Victor L. Berardi. "Revisiting squared-error and cross-entropy functions for training neural network classifiers." Neural Computing & Applications, Vol. 14, No. 4, 2005, pp. 310-18.
- Brownlee, Jason. "What is the difference between a batch and an epoch in a neural network?" Machine Learning Mastery, Vol. 20, 2018.
- Juba, Brendan, and Hai S. Le. "Precision-recall versus accuracy and the role of large data sets." Proceedings of the AAAI Conference on Artificial Intelligence, Vol. 33, No. 1, 2019, pp. 4039-48.
- Berry, Kenneth J., and Paul W. Mielke Jr. "A generalization of Cohen's kappa agreement measure to interval measurement and multiple raters." Educational and Psychological Measurement, Vol. 48, No. 4, 1988, pp. 921-33.
- Felman, A. "Cardiovascular disease: Types, symptoms, prevention, and causes. 2019."
