
Case Series - International Journal of Medical Research & Health Sciences ( 2022) Volume 11, Issue 9
Comparison between Effect of Intravenous Lignocaine and Ketamine in Alleviating Propofol Injection Pain in Patients Undergoing Surgeries under General Anaesthesia
Saravanakumar Rajan*, Sivagurunathan Jawahar and Ashok KulasekharSaravanakumar Rajan, Department of Anaesthesiology, Chettinad Hospital, and Research Institute Kelambakkam,Tamilnadu, India, Email: saravanacena3194@gmail.com
Received: 02-Sep-2022, Manuscript No. ijmrhs-22-73578; Accepted Date: Sep 26, 2022 ; Editor assigned: 05-Sep-2022, Pre QC No. ijmrhs-22-73578 (PQ); Reviewed: 05-Sep-2022, QC No. ijmrhs-22-73578 (Q); Revised: 24-Sep-2022, Manuscript No. ijmrhs-22-73578 (R); Published: 30-Sep-2022
Abstract
Background: Propofol is the most commonly used intravenous inducing agent. Sharp, burning, or aching pain on injection is a major problem. The cardiovascular response to the pain can aggravate adverse events in patients with a history of coronary artery disease Small boluses of ketamine, magnesium, dexmedetomidine, ondansetron, dexamethasone, lignocaine hydrochloride, ketorolac, metoclopramide, and opioids have been tried. Objectives: To compare analgesic effects of using intravenous ketamine and lignocaine in alleviating pain following propofol injection. Methods: A prospective randomized double-blinded study was conducted in Chettinad Hospital and Research Institute, Kelambakkam among 50 participants undergoing surgeries under general anaesthesia . Tourniquet was applied midarm, Group L was given 21.3 mg of 2% lignocaine and Group K was given 15mg of ketamine. Tourniquet was removed after 30 seconds and then 1/3rd dose of a total dose of 2 mg/kg propofol was given. The degree of injection pain was evaluated using the Mccririck Hunter scale. Results: The pain score on propofol injection was similar in both groups. Among the patients, 54% reported no pain, in that 76% of patients were in Group L and 52% of patients in Group K. Mccririck and hunter pain scale ratings between the two groups are similar with a p-value of more than 0.05. Conclusions: The pre-treatment of 15 mg ketamine is as effective as 21.3 mg 2% lignocaine in reducing the severity of propofol injection pain.
Keywords
Propofol, Ketamine, Lignocaine, Propofol injection pain
Introduction
Propofol is the most commonly used intravenous inducing agent internationally because of its rapid onset of action, smooth induction short duration of action, fewer side effects, and rapid recovery properties. It is also used for maintenance and sedation in the intensive care unit. The side effects of propofol include hypotension, apnea, pain on injection, and myoclonus. Pain on injection is a major problem as it causes discomfort to the patient and compromises the analgesia which is an important component of anaesthesia . Pain on injection of propofol incidence in adults ranges from 28% to 90% [1].
Pain on propofol injection can be immediate or delayed after 10 second to 20 seconds. Three out of five patients develop pain on injection and recall the event as very severe pain postoperatively. The pain is described as sharp, burning, or aching. The cardiovascular response to the pain can aggravate adverse events in patients with a history of coronary artery disease.
Few mechanisms have been proposed for the cause of propofol-induced pain like a release of nitric oxide from vessels [2], vein’s adventitia irritation leading to release of cytokines such as “kininogen, kinin, ligand-gated cation channels like transient receptor potential ankyrin 1 and vanilloid 1 were considered as molecules activating peripheral nerve endings [3,4]. The neuropeptides released from the various terminals of sensory neurons induce vasodilatation and vessel leakage and thereby causing inflammation in the periphery neurons and sensitizing root in the dorsal horn of the spinal cord. Also, it is found that an increased amount of propofol in the aqueous phase increases the severity of pain, and hence increasing oil emulsion formulations decreased pain [5]. Even though the pain mechanism remains unsure, several techniques have been tried to alleviate propofol pain. Altering the formulation of the drug, osmolality, pH of the drug, injection volume, temperature, speed of injection, choice of a vein and intravenous cannula size, speed of carrier intravenous fluid, buffering action of blood, and use of preemptive drugs to decrease pain” [6].
Various pharmacological drugs have been tried to reduce propofol-induced pain. The small bolus of Ketamine injection, an N-methyl-D-aspartate antagonist is a well-tried drug to reduce the gradual response to pain. Magnesium, another N-methyl-D-aspartate antagonist blocks calcium ion entry into the cell producing membrane stabilizing action [7]. Dexmedetomidine is gaining attention because of its various favourable effects like sedation, anxiolysis, sympatholytic, and analgesia. It’s a potent alpha-2 adrenoreceptor agonist that releases prostaglandins and causes vasodilation that antagonizes vasoconstriction and causes peripheral antinociception [8]. Ondansetron, a 5 hydroxytryptamine 3 receptor antagonist provided numbness under the skin when injected with no side effects [9]. Nitroglycerine also has an analgesic effect due to its vasodilating action [7].
The use of steroids like dexamethasone alters nitric oxide release and helps to relieve propofol injection pain [10]. A local anaesthetic like intravenous lignocaine hydrochloride is a cation solution. When it gets exposed to lipids in propofol, it liberates protons and decreases the pH of the solution; the lower pH decreases the anions in propofol. Hence more amount of propofol enters into the lipid phase and will cause reduced pain on injection. Other drugs like Nafamostat, Ketorolac, Ephedrine, Metoclopramide, Thiopentone, and Opioids have been tried [11].
The present study is aimed at comparing the analgesic effect between intravenous ketamine and lignocaine in alleviating propofol injection pain.
The primary objective of the present study is to compare the pain scores and incidence of propofol injection pain after giving intravenous ketamine or lignocaine.
The secondary objective of the present study is to compare the severity of propofol injection pain after giving intravenous lignocaine or ketamine.
Case Presentation
The study was carried out in the Department of Anaesthesiology, in Chettinad Hospital and Research Institute, Kelambakkam.
Study Population
The study participants added in this study were patients who underwent surgeries under general anaesthesia with the inclusion criteria.
Sample Size
The sample size calculation is to be 50.
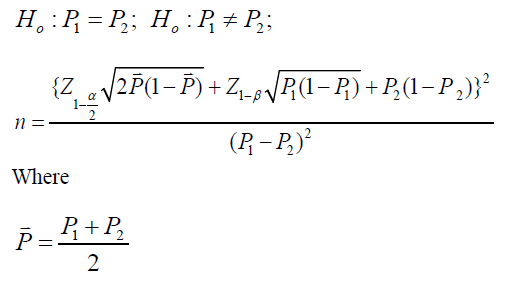
• P1- Proportion in the first group
• P2- Proportion in the second group
• α- Significance level
• 1-β- Power
Inclusion Criteria
American Society of Anaesthesiologists Grade I and II patients undergoing surgeries under general anaesthesia.
• American Society of Anaesthesiologists Grade I normal healthy patient
• American Society of Anaesthesiologists Grade II patient with míld systemic disease
• Age group from 20 years to 60 years of either sex.
Exclusion Criteria
• The patient refused to study.
• Known allergy to study drugs.
• Pregnancy.
• Hemodynamic instability and cardiovascular diseases.
• American Society of Anaesthesiologists Grade III and IV.
Methodology
All patients underwent pre-operative assessment in the pre-anaesthetic assessment clinic and were assessed on the day before surgery.
Patients were randomly categorized into two groups using computer-generated random numbers. The drug was given by an anaesthesiologist who was blinded to the type of the drug.
Group L received 21.3 mg of lignocaine and Group K received 15 mg of ketamine. Before the surgery, the patients underwent pre-anaesthetic fitness and necessary investigations were ordered to be done.
Patients have explained the anaesthetic and anaesthesia procedure during the preoperative visit and written and informed consent was obtained on the previous visit.
Patients were kept fasting for 8 hours before surgery. In the surgical operating theatre, routine monitoring with noninvasive blood pressure, electrocardiography, and pulse oximetry were carried out. Baseline systolic, diastolic, mean arterial pressure, oxygen saturation, and electrocardiography are noted.
An 18 gauge intravenous cannula was secured in a suitable vein on the dorsum of the hand and infused with 100ml Ringer’s lactate solution. No premedication other than the study drug was given to the patients.
The randomization number was kept in sealed opaque envelopes and opened at the time of the study drug preparation. The study drugs, that is, either lignocaine 21.3 mg (Group L) or ketamine 15 mg (Group K) were loaded in identical 5 ml syringes labeled as ‘study drug’ by an independent anaesthesiologist not involved in the study.
After applying the tourniquet in the midarm study drug in the above-mentioned dose was injected into the patients and waited for 30 seconds. After 30 seconds, the tourniquet was removed and one-third of the required dose of propofol was injected and the intensity of pain was scored as per “Mccririck and Hunter Scale” during the propofol injection.
The patient as well as the anaesthesiologist monitoring the patient and response to the drug was unaware of the group allocation. The above pain assessment methodology was selected because the Propofol induced pain starts immediately after injection and the “McCririck and Hunter scale” has been validated in previous studies for evaluation of Propofol induced pain.
It was followed by administration of Injection glycopyrrolate 0.2 mg and atracurium as per the weight of the patient.
The patient was endotracheally intubated with an appropriate-sized endotracheal tube and anaesthesia was continued with nitrous oxide, oxygen, sevoflurane, and intermittent positive pressure ventilation.
Intraoperatively heart rate, blood pressure, oxygen saturation, and end-tidal carbon dioxide were monitored. Any episode of bradycardia (Heart rate <60/minute or a fall of >20% from basal Heart rate), hypotension (mean atrial pressure <60 mm Hg or a fall of >20% from basal Blood pressure), hypertension, or tachycardia (rise of >20% from basal values) was recorded and managed as per the standard protocols.
Statistical Analysis
Data entry: The data were entered using Microsoft Office Excel 2013 and analyzed using SPSS 26 software.
Descriptive statistics: Continuous variables like age, hemodynamic parameters, weight and heart rate, Systolic, and Diastolic Blood Pressure, and oxygen saturation was expressed as mean and standard deviation. Description of categorical variables like Age Category, sex, American Society Anaesthesiologist Grading, distribution of diagnosis, type of surgery performed, side effects, and Mccririck and Hunter pain scale were expressed as frequency and proportion.
Randomization and blinding: Patients were randomly allocated into two groups, by a computer-generated random number table. The allocation sequence was concealed from the investigator by the Serially Numbered Opaque Sealed Envelope (SNOSE) method. The investigator and patient both were both blinded to the group allocations.
Study duration: 2020-2021
Data collection tools: Data Collection was done by trained postgraduate by using structured Proforma. Institutional ethical committee approval was obtained before starting the study. Permission from the collaborated department was obtained.
A structured Proforma includes the following Socio-demographic variables (age, sex), hemodynamic parameters, clinical history, clinical assessment, weight, American Society Anaesthesiologist Grading, Diagnosis, Surgery performed (Elective/Emergency), Heart rate, Systolic Blood Pressure, Diastolic Blood Pressure, oxygen saturation, Electrocardiography and “Mccririck and Hunter pain scale was used to observe and record the data (Table 1).
| Numerical score | Response | Interpretation | Interpretation for statistical analysis |
|---|---|---|---|
| 0 | A negative response to questions | No pain | No pain |
| 1 | The pain reported in response to questions | Mild pain | Mild pain |
| 2 | Voluntary complaint of pain | Moderate pain | Moderate/severe pain |
| 3 | Strong vocal response or facial grimacing | Severe pain |
Ethical Consideration
Ethical principles such as respect for the patient, beneficence, and justice are strictly adhered to. Ethical committee approval was obtained before starting the study. The approval to conduct the present study was obtained from the Institutional Ethics Committee. Informed written consent was obtained from all the study participants before the surgery, after explaining the risks and benefits in a language comfortable to them. Patients have explained the procedure and complications and those were addressed medically. All procedures were done under the supervision of a trained and experienced guide. Confidentiality of the study participants was maintained throughout the study. All the results were shared with the patients at the end of the study.
Test of Significance
An Independent sample T-test was used to compare the two means. Comparisons between the groups on the distribution of qualitative variables were done using the Chi-square test and Fisher’s Exact test. All tests were two-tailed and results were considered statistically significant if the p-value is <0.05 (Table 2 and Figure 1).
| Age Category | Group L | Group K | ||
|---|---|---|---|---|
| Number of Patients | Percentage | Number of Patients | Percentage | |
| 20 years to 30 years | 9 | 36.00% | 11 | 44.00% |
| >30 years to 40 years | 8 | 32.00% | 7 | 28.00% |
| >40 years to 50 years | 4 | 16.00% | 6 | 24.00% |
| >50 years to 60 years | 4 | 16.00% | 1 | 4.00% |
| Total | 25 | 100% | 25 | 100% |
| Mean Age in years + SD | 36.20 + 11.48 | 34.16 + 9.75 | ||
| t-value | 0.68 | |||
| p-value | 0.502 | |||
|
Note: p-value based on student's t-test test |
||||

Figure 1. The error bar diagram shows the mean age among study participants
The mean age among the group L was 36.20+11.48 years and that of Group K was 34.16+9.75 years. Both groups were found to be similar concerning age (p-value of 0.502). The majority of the age group was 20 years to 30 years which is 9 (36%) patients in Group L and 11 (44%) patients in Group K. The minimum age was 20 years in both groups. The maximum age was 59 years in Group L and 55 years in Group K (Table 3 and Figure 2).
| Sex distribution | Group L | Group K | Total | Chi-square (χ2) value, df, p-value |
|---|---|---|---|---|
| Male | 9 (36%) | 8 (32%) | 17 (34%) | 0.09 |
| Female | 16 (64%) | 17 (68%) | 33 (66%) | 1 |
| Total | 25 (100%) | 25 (100%) | 25 (100%) | 0.765 |

Figure 2. Bar diagram shows gender distribution among study participants
In Group L, 64.0% were females and in Group K 68% were females. In both, the group’s females were more than males. The distribution of sex was equal between the groups as shown by a p-value of more than 0.05 (Table 4 Figure 3).
| Group | N | Mean weight in Kgs + Standard Deviation | p-value | ||
|---|---|---|---|---|---|
| Group L | 25 | 61.24 + 11.51 | 0.874 |
|
|
| Group K | 25 | 61.80 + 13.33 |
|
||
|
Note: p-value based on student's t-test test |
|
||||

Figure 3. Box whisker diagram shows weight distribution among study participants
The mean weight of study participants in Group L was 61.24+11.51 kg and that of Group K was 61.80+13.33 Kg. The minimum weight was 40 kg in Group L and 38 kg in Group K. The maximum weight was 80 kg in Group L and 90 Kg in Group K. Both groups had statistically similar mean weights with a p-value of more than 0.05 (Table 5 Figure 4).
| American Society Anaesthesiologist | Group L | Group K | Total | Chi-square (X2) value, df, p-value |
|---|---|---|---|---|
| American Society Anaesthesiologist 1 | 11 (44%) | 10 (40%) | 21 (42%) | 0.08, 1, 0.774 |
| American Society Anaesthesiologist 2 | 14 (56%) | 15 (60%) | 29 (58%) | |
| Total | 25 (100%) | 25 (100%) | 50 (100%) |

Figure 4. Bar diagram shows American Society Anaesthesiologist grading among study participants
Among Group L, 11 (44%) patients were classified as American Society Anaesthesiologists Grading grade 1 and 14 (56%) patients as American Society Anaesthesiologists grade 2. Among Group K, 10 (40%) patients were American Society Anaesthesiologists grade 1 and 15 (60%) were American Society Anaesthesiologists grade 2. The distribution of American Society Anaesthesiologists’ grade status was found to be similar in both groups (Table 6).
| Diagnosis | Group L (n=25) | Group K (n=25) | Total (n=5) | Chi-square (x2) value, df, p-value |
|---|---|---|---|---|
| Adhesive colic | 0 | 1 (4.0%) | 1 (2.0%) | 30.37, 25, 0.211 |
| Adnexal cyst | 1 (4.0%) | 2 (8.0%) | 3 (6.0%) | |
| Appendicitis | 1 (4.0%) | 1 (4.0%) | 2 (4.0%) | |
| AUB | 0 | 2 (8.0%) | 2 (4.0%) | |
| Cholelithiasis | 3 (12.0%) | 1 (4.0%) | 4 (8.0%) | |
| Clavicle fracture | 2 (8.0%) | 1 (4.0%) | 3 (6.0%) | |
| CSOM | 1 (4.0%) | 2 (8.0%) | 3 (6.0%) | |
| DNS | 4 (16.0%) | 1 (4.0%) | 5 (10.0%) | |
| G3P2L2@6 weeks | 0 | 1 (4.0%) | 1 (2.0%) | |
| G3P2L2@15 weeks, incomplete abortion | 1 (4.0%) | 0 | 1 (2.0%) | |
| Gynecomastia | 0 | 1 (4.0%) | 1 (2.0%) | |
| Incisional hernia | 0 | 1 (4.0%) | 1 (2.0%) | |
| Infected sebaceous cyst | 1 (4.0%) | 0 | 1 (2.0%) | |
| Left axillary lymphadenitis | 1 (4.0%) | 0 | 1 (2.0%) | |
| Left breast abscess/lump/fibro adenoma | 6 (24.0%) | 1 (4.0%) | 7 (14.0%) | |
| Left clavicle fracture-lateral one third | 0 | 1 (4.0%) | 1 (2.0%) | |
| Left ear keloid | 0 | 1 (4.0%) | 1 (2.0%) | |
| Multiple lipomatous lesions | 1 (4.0%) | 0 | 1 (2.0%) | |
| P2L2, cervical polyp | 0 | 1 (4.0%) | 1 (2.0%) | |
| P2L2, Prev. LSCS | 0 | 2 (8.0%) | 2 (4.0%) | |
| P2L2A1/P4L4A1 | 0 | 2 (8.0%) | 2 (4.0%) | |
| Recurrent Right shoulder dislocation | 0 | 1 (4.0%) | 1 (2.0%) | |
| Right foot degloving injury | 1 (4.0%) | 0 | 1 (2.0%) | |
| Right Parotid abscess | 1 (4.0%) | 0 | 1 (2.0%) | |
| Sinonasal/antrochonal Polyp | 0 | 2 (8.0%) | 2 (4.0%) | |
| Umbilical hernia with divarication of recti | 1 (4.0%) | 0 | 1 (2.0%) |
Breast related problem was majorly reported in 24% of participants in Group L and 4% in group K followed by DNS (Deviated Nasal Septum) stated in 16% of participants in Group L and 4% in group K. Cholelithiasis was present in 12% of participants in Group L and in group K 4% had Cholelithiasis. Regarding the distribution of diagnosis, both groups were found to be similar with a p-value of more than 0.05 (Table 7 and Figure 5).
| Department | Group L | Group K | Total |
|---|---|---|---|
| General surgery | 16 (64%) | 6 (24%) | 22 (44%) |
| Obstetrics and gynaecology | 2 (8%) | 10 (40%) | 12 (24%) |
| ENT | 5 (20%) | 6 (24%) | 11 (22%) |
| Orthopedic surgery | 2 (8%) | 3 (12%) | 5 (10%) |
| Total | 25 (100%) | 25 (100%) | 50 (100%) |

Figure 5. Cluster bar diagram shows department-wise surgery performed among study participants
Out of 50 patients, the majority of the surgery was done in the general surgery department which 44% in that Group L having 64%, and Group K having 24%. Obstetrics and Gynaecology related surgeries were done in 8% of participants in Group L and 40% patients of in Group K. ENT-related surgeries were done in 20% of participants in Group L and 24% of patients in Group K. Orthopaedic-related surgeries were done in 8% of participants in Group L and 12% patients of Group K (Table 8 and Figure 6).
| Surgery type | Group L | Group K | Total | Chi-square (X2) value, df, p-value |
|---|---|---|---|---|
| Elective | 20 (80.0%) | 23 (92.0%) | 43 (86.0%) | 1.49, 1, 0.221 |
| Emergency surgery | 5 (20.0%) | 2 (8.0%) | 7 (14.0%) | |
| Total | 25 (100%) | 25 (100%) | 50 (100%) |

Figure 6. Bar diagram shows elective/emergency surgery performed between Group L and Group K
Among the study participants 43 (86%) patients were undergone elective surgery in 20 (80%) belongs to Group L and 23 (92%) in Group K. Emergency surgery was performed on 7 (14%) patients in that 5 (20%) belongs to Group L and 2 (8%) in Group K. Elective and Emergency surgery performed between two groups are similar with the p-value of more than 0.05 (Table 9 and Figure 7).
| Group | N | Mean heart rate + Standard deviation | p-value |
|---|---|---|---|
| Group L | 25 | 82.76 +13.57 | 0.29 |
| Group K | 25 | 79.40 +7.93 | |
|
Note: p-value based on student's t-test test |
|||

Figure 7. Error bar diagram shows the mean heart rate among study participants
The mean Heart rate in Group L was 82.76+13.57 b and that of Group K was 79.40+7.93 bpm. The minimum heart rate was 59 beats per minute in Group L and 72 beats per minute in Group K. The maximum heart rate was 103 beats per minute in Group L and 109 beats per minute in Group K. The change in heart rate in both the groups was found to be similar with a p-value of more than 0.05 (Table 10 and Figure 8).
| Group
|
N
|
Mean heart rate + Standard deviation
|
p-value
|
|---|---|---|---|
| Group L
|
25
|
126.00 + 17.53
|
0.493
|
| Group K
|
25
|
123.00 + 12.79
|
|
|
Note: p-value based on student's t-test test |
|||

Figure 8. Error bar diagram shows the mean SBP among study participants
The mean Systolic Blood Pressure in Group L was 126.00+17.53 mm hg and that of Group K was 123.00+12.79 mm hg. The minimum Systolic Blood Pressure was 90 mm hg in Group L and 107 mm hg in Group K. The maximum Systolic Blood Pressure was 150 mm hg in both groups. The mean systolic blood pressure in both groups was found to be similar with a p-value of more than 0.05 (Table 11 and Figure 9).
| Group
|
N
|
Mean Diastolic Blood Pressure (mm hg) + Standard deviation
|
p-value
|
|---|---|---|---|
| Group L
|
25
|
77.96 + 7.86
|
0.653
|
| Group K
|
25
|
76.84 + 9.57
|
|
|
Note: p-value based on student's t-test test |
|||

Figure 9. Error bar diagram shows the mean DBP among study participants
The mean Diastolic Blood Pressure in Group L was 77.96+7.86 mm hg and that of Group K was 76.84+9.57 mm hg. The minimum Diastolic Blood Pressure was 60 mm hg in Group L and 52 mm hg in Group K. The maximum Diastolic Blood Pressure was 90 mm hg in Group L and 94 mm hg in Group K. The mean Diastolic blood pressure in both the groups was found to be similar with a p-value of more than 0.05 (Table 12 and Figure 10).
| Group | N | Mean Arterial Pressure + Standard deviation | p-value |
|---|---|---|---|
| Group L | 25 | 93.96 + 10.53 | 0.527 |
| Group K | 25 | 92.16 + 9.40 | |
|
Note: p-value based on student's t-test test |
|||

Figure 10. Error bar diagram shows the Mean Arterial Pressure among study participants
The Mean Arterial Pressure in Group L was 93.96+10.53 mm hg and that of Group K was 92.16+9.40 mm hg. The minimum Mean Arterial Pressure was 70 mm hg in Group L and 71 mm hg in Group K. The maximum Mean Arterial Pressure was 110 mm hg in both groups. The Mean Arterial Pressure in both the groups was found to be similar with a p-value of more than 0.05 (Table 13 and Figure 11).
| Group | N | Mean oxygen saturation + Standard deviation | p-value |
|---|---|---|---|
| Group L | 25 | 99.92 + 0.28 | 1 |
| Group K | 25 | 99.92 + 0.28 | |
|
Note: p-value based on student's t-test test |
|||

Figure 11. Error bar diagram shows the mean oxygen saturation among study participants
The Mean oxygen saturation was 99.92+0.28 in both groups. The minimum Mean Arterial Pressure was 99 and the maximum Mean Arterial Pressure was 100 in both groups. The Mean Arterial Pressure in both the groups was found to be similar with a p-value of more than 0.05 (Table 14 and Figure 12).
| Group | N | Mean oxygen saturation + Standard deviation | p-value |
|---|---|---|---|
| Group L | 25 | 99.92 + 0.28 | 1 |
| Group K | 25 | 99.92 + 0.28 | |
|
Note: p-value based on student's t-test test |
|||

Figure 12. Mccririck and Hunter Pain Scale rating among study participants
Out of 50 patients, 32 (54%) reported no pain, while 19 (76%) patients were in Group L and 13 (52%) patients were in Group K. Among the study participants, 16 (32%) reported mild pain in that 6 (24%) belonged to Group L and 10 (40%) in Group K. Moderate pain was reported in 2 (4.0%) patients in Group K. Mccririck and Hunter Pain Scale rating between two groups are similar with the p-value of more than 0.05 (Table 15 and Figure 13).
| Gender | Mccririck and Hunter Pain Scale | Total | p-value | ||
|---|---|---|---|---|---|
| No pain | Mild pain | Moderate pain | |||
| Group L | |||||
| Male | 8 (88.9%) | 1 (11.1%) | 0 | 9 | 0.364 |
| Female | 11 (68.8%) | 5 (31.2%) | 0 | 16 | |
| Group K | |||||
| Male | 5 (62.5%) | 2 (25.0%) | 1 (12.5%) | 8 | 0.564 |
| Female | 8 (52.0%) | 8 (47.1%) | 1 (5.9%) | 17 | |

Figure 13. Cluster bar diagram shows Mccririck and Hunter pain scale between genders
In ten patients, the modality opted for was maximal TURBT followed by chemoradiation out of which 6, 2, and 2 Out of 9 male patients in group L1(11.1%) patient reported mild pain and 8 (88.9%) patients reported no pain. Among 16 female patients in group L5 (31.2%) patients reported mild pain and 11 (68.8%) patients reported no pain.
Out of 8 male patients in group K1 (12.5%), patients reported moderate pain, 2 (25.0%) patients reported mild pain and 5 (62.5%) patients reported no pain. Among 17 female patients in group L1 (5.9%) patients reported moderate pain, 8 (47.1%) patients reported mild pain and 8 (52.0%) patients reported no pain. McCRIRICK and Hunter pain scale between genders shows an equal distribution in both the groups with a p-value of more than 0.05 (Table 16).
|
Side effects |
Group L (n=25) | Group K (n=25) | Total (n=50) |
|---|---|---|---|
| Nausea | |||
|
Yes |
0 | 0 | 0 |
|
No |
25 (100%) | 25 (100%) | 50 (100%) |
| Bradycardia | |||
|
Yes |
0 | 0 | 0 |
|
No |
25 (100%) | 25 (100%) | 50 (100%) |
| Vomiting | |||
|
Yes |
0 | 0 | 0 |
|
No |
25 (100%) | 25 (100%) | 50 (100%) |
| Hypotension | |||
|
Yes |
0 | 0 | 0 |
|
No |
25 (100%) | 25 (100%) | 50 (100%) |
| Hypertension | |||
|
Yes |
0 | 0 | 0 |
|
No |
25 (100%) | 25 (100%) | 50 (100%) |
| Tachycardia | |||
|
Yes |
0 | 0 | 0 |
|
No |
25 (100%) | 25 (100%) | 50 (100%) |
Discussion
The present study was a double-blinded prospective randomized study carried out to evaluate the analgesic effect of 1 ml of 2% lignocaine versus 15 mg of ketamine for alleviating propofol injection pain in patients undergoing general anaesthesia . In both, groups, baseline systolic, diastolic, mean arterial pressure, and oxygen saturation were noted. The degree of injection pain was evaluated using the Mccririck Hunter scale during propofol injection.
Basic Demographic Characters
The mean age among the lignocaine group was 36.20+11.48years and that of the ketamine group was 34.16+9.75 years. Both groups were found to be similar in age with a p-value of 0.502 which is more than 0.05. This was almost similar to the study done on 108 patients by Thukral S et al who compared dexmedetomidine with ketamine to alleviate propofol injection pain which had a mean age of 34.04 ± 8.30 and 31.96 ± 8.71 respectively [1].
Sex distribution was the same between the groups with a p-value of 0.765 which was more than 0.05. Group L and K constituted 64% and 68% females, 36% and 32% males respectively with females being more than males. In the present study out of 9 male patients in group L, 11.1 % of patients reported mild pain and 88.9% of patients reported no pain. Among 16 female patients in the group, L 31.2% of patients reported mild pain, and 68.8% of patients showed no pain. Out of 8 male patients in group K, 12.5% of patients reported moderate pain, 25.0% of patients reported mild pain, and 62.5% of patients reported no pain. Among 17 female patients in group L, 5.9% of patients reported moderate pain, 47.1% of patients reported mild pain, and 52.0% patients reported no pain. Mccririck and Hunter’s pain scale between genders shows an equal distribution in the groups with a p-value of more than 0.05. A study done by Kang HJ, et al. found that young female patients with IV peripheral lines vocalized more intensity of pain [6].
The mean weight of study participants among the lignocaine group was 61.24+11.51 kgs and that of the ketamine group was 61.80+13.33 Kgs which was comparable with a p-value of 0.874 and hence no difference between the groups. This was analogous to the research done by Shivanna S., et al. where he compared the effects of methylprednisolone and lignocaine in 165 patients to reduce propofol injection pain. The patients were in mean weight of 61.56 ± 9.33 and 61.64 ± 9.23 respectively. He proved methylprednisolone and lignocaine had equal effects to reduce propofol pain [12].
Anaesthesia Characteristics
Among the Group L, 44% of patients were classified as American Society of Anaesthesiologists grading 1, and 56% of patients as American Society of Anaesthesiologists grading 2. Among Group K, 40% of patients were American Society of Anaesthesiologists grading 1 and 60% were American Society of Anaesthesiologists grading 2. The distribution of the American Society of Anaesthesiologists’ grading status was found to be similar in both groups with a p-value of 0.774.
Dosage of Drug
In this study, we used 21.3 mg 2% Lignocaine and 15 mg Ketamine for comparison to alleviate propofol injection pain. Barbi E. et al, showed that 0.5 mg/kg Ketamine pre-treatment was more efficient to relieve Propofol injection pain than a mixture of lignocaine and propofol [13]. Tan CH. et al conducted a randomized study on 100 patients to study the efficacy of 10mg of Ketamine to reduce propofol injection pain [14]. He concluded that the 10 mg (0.2 mg/ kg) dose was low and doesn’t cause a central analgesic effect but is enough to produce local anaesthetic action in the peripheral intravenous line and is effective to reduce Propofol injection pain. Sumalatha GB. et al, compared 0.5 mg/ kg 2% Lignocaine, Ramosetron, and Ondansetron and proved that Lignocaine in 0.5 mg/kg reduced Propofol injection pain. Shivanna S. et al, compared the effects of 20 mg of Lignocaine and Methylprednisolone and proved 38% had no pain on injection, and 14% had mild pain with Lignocaine. Hence we chose a minimum of 21.3 mg of 2% Lignocaine and 15 mg of Ketamine to compare [12].
Hemodynamic Variables
The mean heart rate in Group L was 82.76+13.57 beats per minute and that of Group K was 79.40+7.93 beats per minute. The minimum heart rate was 59 beats per minute in Group L and 72 beats per minute in Group K. The maximum heart rate was 103 beats per minute in Group L and 109 beats per minute in Group K. The change in heart rate in both the groups was found to be similar with a p-value of 0.290 which is more than 0.05.
The mean Systolic Blood Pressure in Group L was 126.00+17.53 mm hg and that of Group K was 123.00+12.79 mm hg. The minimum Systolic Blood Pressure was 90 mm hg in Group L and 107 mm hg in Group K. The maximum Systolic Blood Pressure was 150 mm hg in both groups. The mean systolic blood pressure in both groups was found to be similar with a p-value of 0.493.
The mean Diastolic Blood Pressure in Group L was 77.96+7.86 mm hg and that of Group K was 76.84+9.57 mm hg. The minimum Diastolic Blood Pressure was 60 mm hg in Group L and 52 mm hg in Group K. The maximum Diastolic Blood Pressure was 90 mm hg in Group L and 94 mm hg in Group K. The mean Diastolic blood pressure in both the groups was found to be similar with a p-value of 0.653.
The Mean Arterial Pressure in Group L was 93.96+10.53 mm hg and that of Group K was 92.16+9.40 mm hg. The minimum Mean Arterial Pressure was 70 mm hg in Group L and 71 mm hg in Group K. The maximum Mean Arterial Pressure was 110 mm hg in both groups. The Mean Arterial Pressure in both the groups was found to be similar with a p-value of 0.527 which is more than 0.05.
The Mean oxygen saturation was 99.92+0.28 in both groups. The minimum Mean Arterial Pressure was 99 and the maximum Mean Arterial Pressure was 100 in both groups. The Mean Arterial Pressure in both the groups was found to be similar with the p-value of one.
Electrocardiogram was normal sinus rhythm in all patients of both the groups. There were no side effects reported during the procedure in both the groups. Hence we observed that the ketamine group patients did not show hypertension/ tachycardia since the dose administered was only 15 mg.
Pain Score
Out of 50 patients, 54% reported no pain, in that 76% of patients were in Group L and 52% were patients in Group K. Among the study participants, 32% reported mild pain in that 24% belonged to Group L and 40% in Group K. Moderate pain was reported in 4.0% of patients in Group K. severe pain was not reported in both groups. Mccririck and Hunter’s pain scale ratings between the two groups are similar with a p-value of 0.127 which was more than 0.05.
A similar pain score was seen in a study done by Thukral S. et al, who used 0.5 mg/kg ketamine in 54 patients to reduce propofol injection pain where 59% reported no pain, and 38.95% reported mild pain after propofol injection [1].
A similar pain score was seen in a study done by Shivanna S. et al, who used 20 mg lignocaine in 55 patients to reduce propofol injection pain where 69% reported no pain, 25.5% reported mild pain, 3.6% reported moderate pain after propofol injection [12].
Also, Sumalatha GB. et al, used 0.5 mg/kg 2% lignocaine in 50 patients to reduce propofol injection pain where 76% reported no pain, 18% reported mild pain, and 4% reported moderate pain after propofol injection similar to our study [15].
Conclusion
The pre-treatment of 15 mg ketamine is as effective as 21.3 mg 2% lignocaine in reducing the severity of propofol injection pain.
Acknowledgment
On completion of this study, it gives me deep pleasure to acknowledge the guidance provided by my distinguished mentors. It is most appropriate to express my indebtedness to my parents, who prepared me for facing the challenges of life and who led me to this climb on the ladder of my career. With privilege and respect, I would like to express my gratitude and indebtedness to my role model, my esteemed teacher-mentor Head of Department, Prof Dr. Ashok Kulasekara for his constant inspiration, valuable suggestions, extensive encouragement, and support which he rendered in my study. I would like to express my gratitude to Dr. Sivagurunathan for his constant help throughout the study. I am forever grateful to Professor Dr. Balamurugan and Professor Dr. Anand for their valuable support throughout the study. I would like to thank the respected members of the Postgraduate Committee and Institutional Human Ethics Committee for their continuous guidance and support.
Declarations
Conflict of Interest
The authors declared no potential conflicts of interest with respect to the research, authorship, and/or publication of this article.
Funding Sources
This research did not receive any specific grant from funding agencies in the public, commercial, or not-for-profit sectors.
References
- Thukral, Seema, et al. "Dexmedetomidine versus ketamine infusion to alleviate propofol injection pain: A prospective randomized and double-blind study." Indian Journal of Anaesthesia, Vol. 59, No. 8, 2015, p. 488.
Google Scholar Crossref - Sim, Ji-Yeon, et al. "Pain on injection with microemulsion propofol." British journal of clinical pharmacology, Vol. 67, No. 3, 2009, pp. 316-25.
Google Scholar Crossref - Desousa, Kalindi A. "Pain on propofol injection: Causes and remedies." Indian journal of pharmacology, Vol. 48, No. 6, 2016, p. 617.
Google Scholar Crossref - Matta, José A., et al. "General anaesthetic s activate a nociceptive ion channel to enhance pain and inflammation." Proceedings of the National Academy of Sciences, Vol. 105, No. 25, 2008, pp. 8784-9.
Google Scholar Crossref - Scott, R. P. F., D. A. Saunders, and J. Norman. "Propofol: clinical strategies for preventing the pain of injection." Anaesthesia, Vol. 43, No. 6, 1988, pp. 492-4.
Google Scholar Crossref - Kang, Hye-Joo, et al. "Clinical factors affecting the pain on injection of propofol." Korean journal of anesthesiology, Vol. 58, No. 3, 2010, pp. 239-43.
Google Scholar Crossref - Singh, Dhananjay K., Parul Jindal, and Gaurav Singh. "Comparative study of attenuation of the pain caused by propofol intravenous injection, by granisetron, magnesium sulfate and nitroglycerine." Saudi journal of anaesthesia, Vol. 5. No. 1, 2011, p. 50.
Google Scholar Crossref - Sapate M, Andurkar U., et al. " To study the effect of injection dexmedetomidine for prevention of pain due to propofol injection and to compare it with injection lignocaine." Brazilian Journal of Anesthesiology, Vol. 65, No. 6, 2015, pp. 466-9.
Crossref - Ahmed, Ahsan, et al. "Pre-treatment with intravenous granisetron to alleviate pain on propofol injection: A double-blind, randomized, controlled trial." Indian journal of anaesthesia, Vol. 56, No. 2, 2012, p. 135.
Google Scholar Crossref - Rollison, Julia, et al. "Enhanced Recovery After Surgery for Vascular Surgery." 2019.
Google Scholar Crossref - Koo, Seung-Woo, et al. "Small-dose ketamine reduces the pain of propofol injection." Anaesthesia and Analgesia, Vol. 103, No. 6, 2006, pp. 1444-47.
Google Scholar Crossref - Shivanna, Shivaprakash, et al. "Efficacy of methylprednisolone and lignocaine on propofol injection pain: A randomised, double-blind, prospective study in adult cardiac surgical patients." Indian Journal of Anaesthesia, Vol. 60, No. 11, 2016, p. 848.
Google Scholar Crossref - Barbi, E., et al. "Pretreatment with intravenous ketamine reduces propofol injection pain." Pediatric anaesthesia , Vol. 13, No. 9, 2003, pp. 764-68.
Google Scholar Crossref - Fujii, Yoshitaka, and Masahiro Nakayama. "Retracted Article: A lidocaine/metoclopramide combination decreases pain on injection of propofol." Canadian Journal of Anaesthesia , Vol. 52, No. 5, 2005, pp. 474-77.
Google Scholar Crossref - Sumalatha, Gangur Basappa, et al. "A comparative study of attenuation of propofol-induced pain by lignocaine, ondansetron, and ramosetron." Indian Journal of Anaesthesia, Vol. 60, No. 1, 2016, p. 25.
Google Scholar Crossref