Research - International Journal of Medical Research & Health Sciences ( 2021) Volume 10, Issue 2
Antihypertensive and Antihyperlipidemic Effects of Thymoquinone in L-NAME-Induced Hypertensive Rats
Marwan Saad Azzubaidi1*, Uday Younis Hussein Abdullah1, Nordin bin Simbak1, Shazia Jamshed2 and Hussam Mizher32Faculty of Pharmacy, University Sultan Zainal Abidin, Kuala Terengganu, Malaysia
3Faculty of Pharmacy, International Islamic University Malaysia, Kuantan Campus, Malaysia
Marwan Saad Azzubaidi, Faculty of Medicine, University Sultan Zainal Abidin, Kuala Terengganu, Malaysia, Email: mazzubaidi@gmail.com
Received: 30-Dec-2020 Accepted Date: Feb 11, 2021 ; Published: 18-Feb-2021
Abstract
Thymoquinone (TQ) is gaining increasing considerations in medical research due to its broad spectrum of biological activities against diseases such as neurodegeneration and hypertension. The objective of this study was to evaluate the antihypertensive and lipid-lowering potential of TQ on L-NAME-induced hypertensive rats. Hypertension was induced in 36 Sprague Dawley rats by administration of L-Nitro-Arginine Methyl Ester (L-NAME) in drinking water for 4 weeks. Then rats were divided into 6 groups (n=6): L-NAME–alone, L-NAME+TQ2.5, L-NAME+TQ5, L-NAME+TQ10, L-NAME+captopril, and control. Mean Arterial Pressure (MAP) and heart rate was recorded by the non-invasive tail-cuff technique weekly for 28 days. TQ reversed established hypertension in TQ5 and TQ10 groups and prevented further increase in MAP in the TQ2.5 group. Unlike the captopril treated group, TQ antihypertensive activity was associated with an increase in serum aldosterone concentration and ACE activity. TQ treatment at the high dose significantly lowered total cholesterol and LDL levels in comparison with the healthy control group at the end of the 4th week of treatment. This study confirms the antihypertensive action of TQ. Furthermore, it can be concluded that inhibition of ACE did not play a role in the underlying antihypertensive mechanism. However, blocking angiotensin II receptors is a likely mechanism for lowering the MAP.
Keywords
Thymoquinone, L-NAME, Hypertension, Captopril, Rats
Introduction
Thymoquinone was found to possess a hypotensive effect both in normotensive rats and in hypertensive rats in which hypertension was induced after blocking the nitric oxide synthase enzyme for four weeks by L-NAME [1,2]. Thymoquinone was reported to prevent the rise in blood pressure observed in L-NAME treated group when administered concomitantly.
L-NAME model is widely accepted to screen the possible activity of many natural products for their anti-hypertensive potential, as well as to explore the underlying mechanism of action that could be involved. L-NAME effect on MAP and heart rate is mainly due to the depletion of the nitric oxide released by vascular endothelial cells and the renal vasoconstriction [3].
Juxtaglomerular apparatus secretes renin in response to a decrease in blood pressure leading to activation of the Renin-Angiotensin-Aldosterone System (RAAS). Overactivity of this system especially its well-known Angiotensin- Converting Enzyme (ACE) is strongly believed to play a role in the pathogenesis of hypertension. On the other hand, inhibitors of this enzyme (ACEi) are widely used as antihypertensive drugs. Captopril, the ACEi, was used in this research as a positive control to compare its effect with that of different doses of TQ in L-NAME-induced hypertension.
Materials and Methods
Animals
36 male Sprague-Dawley rats weighing 220 g-260 g were used in the study. Animals were kept in pairs in the animal lab facility, Kulliyah of Pharmacy, International Islamic University Malaysia at 26 ± 1°C and 12-hour day/night cycle. This protocol was approved by (The Integrated Centre for Research Animal Care and Use, IIUM). Rats were acclimatized for one week before starting the experiment where they were allowed access to rat food pellets and drinking water ad libitum.
National guidelines for the use of laboratory animals were followed. The animal was treated humanely and general anesthetics were used before animals were sacrificed. The experimental animals’ ethical committee at the university has scrutinized and approved the experiment procedures.
Induction of Hypertension
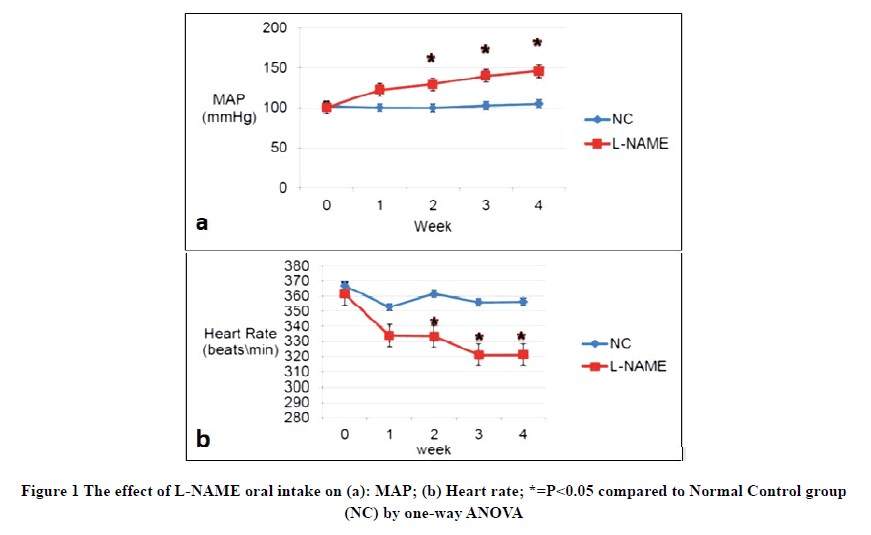
Several training sessions were conducted during the acclimatization period using the tail-cuff device to minimize the stress-induced effect on the tested parameters. After the acclimatization period, six rats were randomly chosen as Normal Control (NC) group. Hypertension was induced in the remaining 30 animals using the reversible nitric oxide synthase inhibitor (L-NAME) dissolved in their drinking water for four weeks at a concentration of 400 mg/L equivalents for a daily dose of (45-55) mg/kg [4]. Bodyweight, Mean Arterial Pressure (MAP), and Heart Rate (HR) were measured weekly for four weeks by the non-invasive tail-cuff technique. Both groups (normal control and L-NAME treated groups) had a normal MAP of 102 mmHg and 100 mmHg respectively, on the first day of L-NAME treatment. MAP started to progressively increase in L-NAME treated group compared to NC, reaching 122 mmHg after one week of L-NAME ingestion. A statistically significant difference was achieved starting from the second week of induction and the MAP of L-NAME treated group maintained its significantly higher levels till the end of the fourth week as shown in Figure 1a. Conversely, the mean HR decreased significantly throughout the weeks of the induction of hypertension in the L-NAME treated group compared to the NC group (Figure 1b).
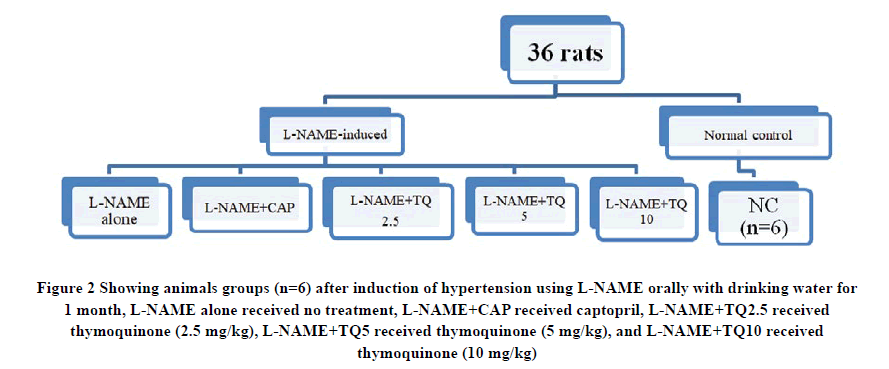
At the end of the fourth week of induction with L-NAME, 30 hypertensive rats were randomly divided into five groups (n=6) depending on the type of treatment these animals received during the subsequent 4 weeks of the study, as shown in Figure 2.
Figure 2 Showing animals groups (n=6) after induction of hypertension using L-NAME orally with drinking water for 1 month, L-NAME alone received no treatment, L-NAME+CAP received captopril, L-NAME+TQ2.5 received thymoquinone (2.5 mg/kg), L-NAME+TQ5 received thymoquinone (5 mg/kg), and L-NAME+TQ10 received thymoquinone (10 mg/kg).
TQ and Captopril Treatments
Thymoquinone was dissolved in vegetable oil and administered in a volume not exceeding 0.2 ml as a single oral dose by force oral feeding. Captopril was dissolved in their drinking water and was prepared according to the method previously described by Simko, et al. with minor modification whereby five tablets of 25 mg of captopril were crushed into a fine powder, and then water was added and mixed to form a paste-like formula [5]. Subsequently, more water was added to achieve the final volume. The solution then was filtered to remove any insoluble constituents. This procedure was carried out every two days.
Lipid Profile Testing
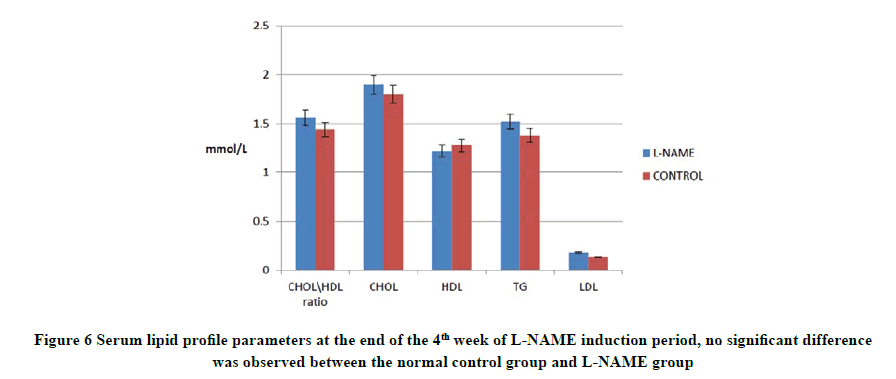
Lipid profile parameters were assessed twice using COBAS INTEGRA® 400 plus kits (Roche) to measure Total Cholesterol (TC), High-Density Lipoprotein (HDL), Low-Density Lipoprotein (LDL), and Triglyceride (TG). The first measurement was at the end of hypertension induction where no statistical difference was observed between the NC group and L-NAME group. The second analysis was carried out at the end of the treatment period.
Blood samples were collected through the orbital vein puncture using capillary tubes under diethyl ether inhaled anesthesia. Blood samples were allowed to clot, centrifuged at 1500 g for 15 minutes (Hettich, Zentrifugen D78532) and the obtained serum was stored at -80°C until assayed.
ELISA Assay
At the end of the treatment period, rats were anesthetized by diethyl ether in a desiccator, and blood was directly collected by exsanguination. The collected blood samples were centrifuged at 1500 g at 4°C for 20 minutes. The obtained serum was stored at -20°C until aldosterone and ACE activity were assayed according to protocols reported by duplicate Suli and Xie, and Shimamura, et al. respectively [6,7].
Statistical Analysis
Data were expressed as mean ± SD through SPSS version 20, using one-way ANOVA followed by Tukey test. pvalue< 0.05 was considered statistically significant.
Results
Induction of Hypertension
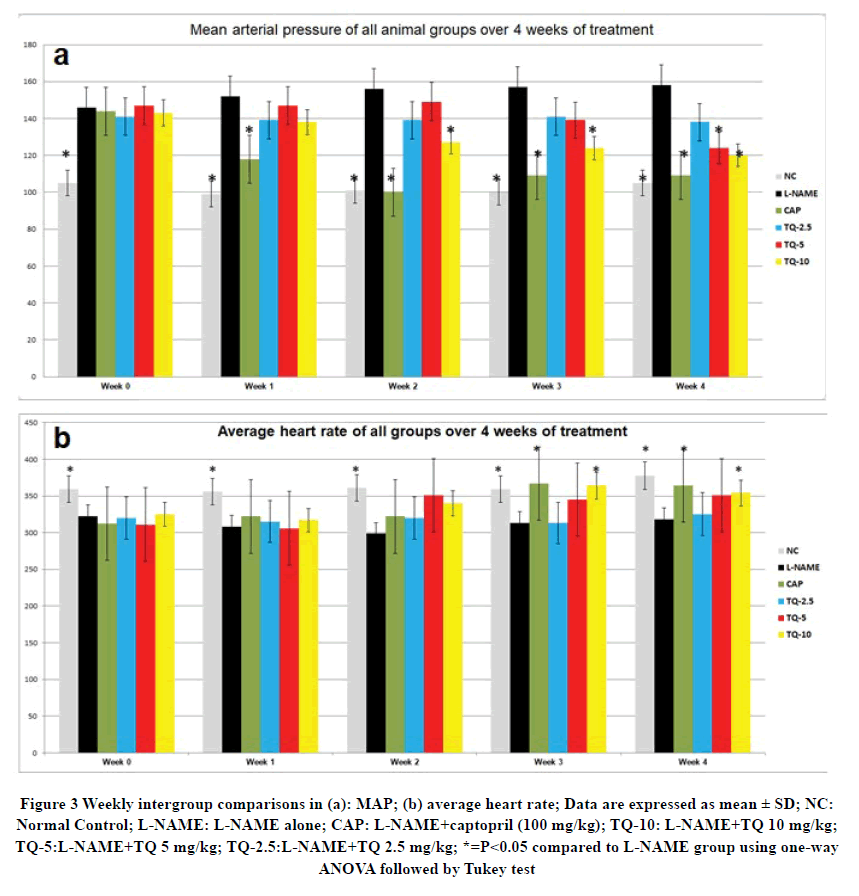
L-NAME treated groups showed a statistically significant increase in their MAP compared to the control group at 0 times (before starting TQ and CAP treatments) and a statistically significant decrease in heart rate (Figure 3). An immediate decrease in MAP of the CAP-treated group was noticed as early as week 1 of treatment. On the other hand, a gradual subsequent decrease in MAP of the TQ treated groups was observed which followed a dose-dependent fashion. The TQ10-treated group showed the most significant reduction in MAP during weeks 3 and 4 of treatment, while TQ-5 treated group demonstrated a significant reduction in MAP compared to the L-NAME group only at the 4th week of treatment (Figure 3 a).
Figure 3 Weekly intergroup comparisons in (a): MAP; (b) average heart rate; Data are expressed as mean ± SD; NC: Normal Control; L-NAME: L-NAME alone; CAP: L-NAME+captopril (100 mg/kg); TQ-10: L-NAME+TQ 10 mg/kg; TQ-5:L-NAME+TQ 5 mg/kg; TQ-2.5:L-NAME+TQ 2.5 mg/kg; *=P<0.05 compared to L-NAME group using one-way ANOVA followed by Tukey test
ELISA Assay for Serum Aldosterone
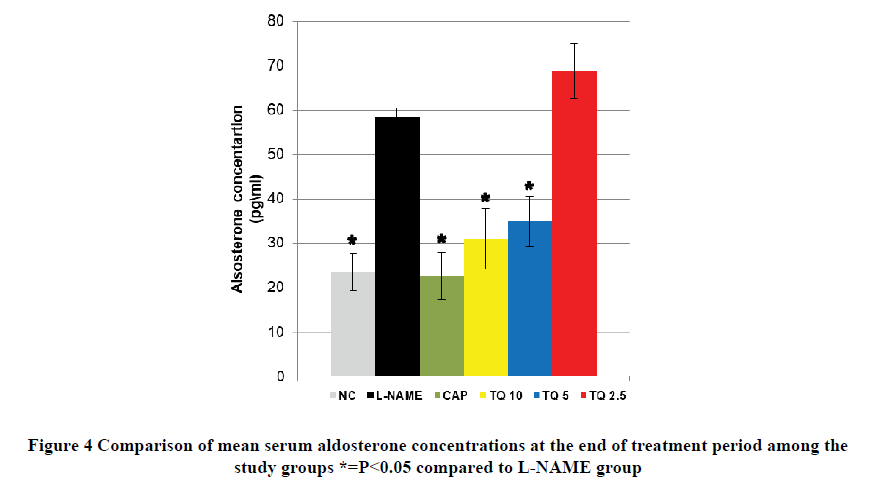
Aldosterone concentration in the L-NAME group was approximately three times more than NC, and this difference was highly significant. The CAP-treated group demonstrated a comparable aldosterone level to that of the NC group which is significantly lower than the L-NAME group as shown in Figure 4. TQ-5 and TQ-10 treated groups showed a significant reduction in aldosterone concentration compared to the L-NAME group. However, the thymoquinone 2.5 mg/kg treated group was insignificantly different in aldosterone serum concentration compared to the L-NAME group as shown in Figure 4.
Angiotensin-Converting Enzyme Inhibition Activity
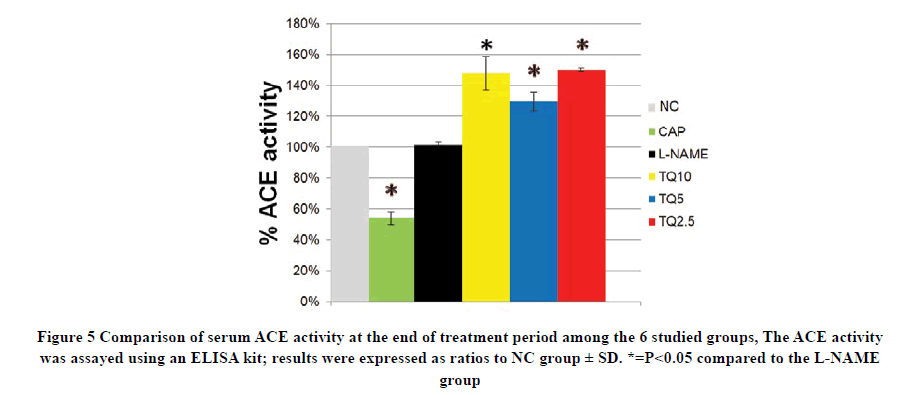
There was no statistical difference in ACE activity between L-NAME and NC groups while captopril treatment sharply decreased ACE activity to 50% of NC value. Interestingly, all TQ treated groups showed an elevation in ACE activity compared to the L-NAME group and this increment was not dose-dependent but reached statistically significant against the L-NAME group as shown in Figure 5.
Lipid profile assessments
Components of lipid profile (CHOL, HDL, TG, and LDL) were measured twice, after the hypertension induction stage and the end of the treatment period. As for the former, the four tested parameters showed no statistical difference between L-NAME treated and NC groups as shown in Figure 6.
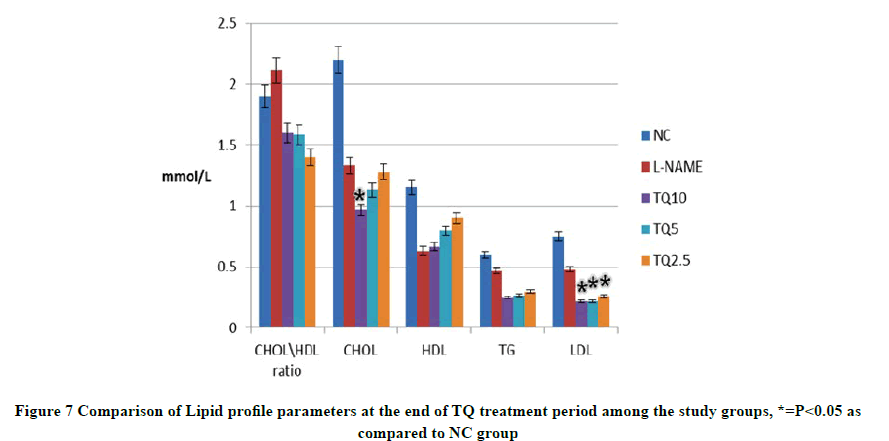
At the end of the treatment period, although the total cholesterol level in all TQ-treated groups declined, only the TQ10 group decrease was statistically significant compared to the NC group. On the other hand, the LDL level in all TQtreated groups showed a significant dose-dependent reduction in comparison with the NC group. Moreover, TG level was also less in TQ-treated groups than NC group even though it was not a significant difference. Similarly, HDL level was insignificantly higher in NC than TQ treated groups as shown in Figure 7.
Discussion
The present study findings support what was previously described regarding the use of L-NAME to elevate MAP after oral administration for two months [3,4].
Heart rate started to decrease in the L-NAME group one week after starting the treatment while a significant difference was only observed after two weeks of induction compared with the mean heart rate of the control group. The concomitant reduction in heart rate with the increase in blood pressure is most likely due to the compensatory baroreflex mediated mechanism in response to the elevation in MAP [8].
This result was in agreement with Bernatova, et al. who reported that L-NAME administration caused a significant decrease in heart rate [9]. However, Numaguchi, et al. reported no changes in heart rate readings before and after induction of hypertension [10]. This may be explained by the differences in L-NAME dose. Bernatova, et al. administered 40 mg/kg per day of L-NAME in the drinking water, and this was comparable to the L-NAME dose in the present study. On the other hand, Numaguchi, et al. used 100 mg/kg per day L-NAME dose [10]. The latter also reported a one-third of rats’ fatality rate within the 2 months of the experiment while they were receiving L-NAME alone; while no deaths were recorded with the use of 45 mg/kg per day dose. Furthermore, the higher L-NAME dose had affected the bodyweight leading to a significant animal weight loss, whereas in the current study and in that of Bernatova, et al. L-NAME treatment had no significant effect on the animals’ body weight [9]. The high dose of L-NAME used by Numaguchi, et al. could be the factor that led to the significant decrease in animals’ body weight compared to the normal control.
Interestingly, the mean body weight did not significantly change after 4 and 8 weeks of L-NAME treatment with the dose of 20-30 mg/kg per day. However, a considerable reduction in weight was reported compared to that of the control group after 12 weeks [11]. This might indicate that the animals’ body weight would decrease with higher L-NAME doses and prolonged treatment periods as compared to the smaller doses and shorter durations of L-NAME treatment.
This is among the pioneer studies to prove the capacity of oral thymoquinone to restore MAP to normotensive levels in the experimental model of hypertension.
Both captopril and thymoquinone treatments have resulted in a significant reduction in L-NAME induced rise in aldosterone level. However, only the CAP-treated group showed a significant parallel decline in ACE activity compared to the control group. Contrastingly, all TQ-treated groups showed an ACE activity level that was insignificantly different from that of the control group. This elevated ACE activity in TQ-treated groups indicated that the reduction in aldosterone concentration by thymoquinone was not mediated by the ACE inhibition effect. Therefore, the present study suggests that the significant decrease in aldosterone level by TQ is probably mediated by the blockage of angiotensin II receptors, an action quite similar to that of losartan as reported by Ülger, et al. [12].
TQ treated groups showed no significant differences in HDL levels as compared to the NC group. This finding differed from reports asserted by other studies that detected an increase in HDL levels in previous hyperlipidemic models [13]. This disagreement with the results in the current study is thought to be partially due to the differences in the types and amounts of oil vehicles used to dissolve TQ. Additionally, the animal model to induce hyperlipidemia used by the previous studies could have influenced HDL level in the first place by mechanisms that cannot be applied in the present model. In accordance with other study accounts, all TQ-treated groups (TQ-2.5, TQ-5, and TQ-10) significantly reduced the LDL levels as compared to the NC group. However, only the TQ-10 treated group was found to cause a significant decrease in total cholesterol level as compared to the untreated NC and L-NAME groups. This may indicate that only higher doses of TQ are capable of inhibiting the HMG-CoA reductase enzyme which was reported to be blocked by TQ in prior studies [14].
Conclusion
Administration of L-NAME raises the MAP progressively over the 4 weeks. The antihypertensive action of TQ is evident in the L-NAME experimental model of hypertension in which TQ was found to reverse the established hypertension. This was associated with a significant decrease in serum aldosterone concentration despite the increase in the ACE activity, suggesting a role played by TQ through the renin-angiotensin-aldosterone system mechanism.
Declarations
Acknowledgment
Researchers are thankful to the Research Management Center of the International Islamic University Malaysia for supporting this study with the grant number (EDW B 14-214-1099).
Conflict of Interest
The authors declared no potential conflicts of interest with respect to the research, authorship, and/or publication of this article.
References
- Azzubaidi, MARWAN SAAD, H. U. S. S. A. M. Mizher, and AHMED GHAZI Alattraqchi. "Hypotensive activity of thymoquinone in normotensive rats and its receptor mechanisms."International Journal of Pharmacy and Pharmaceutical Sciences,Vol. 9, No. 8, 2017, pp. 216-18.
- Azzubaidi, Marwan S., Noriah M. Noor, and Hussam A. Mizher. "Antihypertensive and antihyperlipidemic activities of thymoquinone in L-name hypertensive rats."Journal of Hypertension,Vol. 33, 2015, pp. e7-e8.
- Alwi, N. A. N. M., et al. "Antihypertensive Effect of Piper sarmentosum in L-NAME-Induced Hypertensive Rats."Sains Malaysiana, Vol. 47, No. 10, 2018, pp. 2421-28.
- Abdel-Rahman, Rehab F., et al. "Antihypertensive effects of roselle-olive combination in L-NAME-induced hypertensive rats."Oxidative Medicine and Cellular Longevity,Vol. 2017, 2017.
- Simko, Fedor, et al. "Hypertension and cardiovascular remodelling in rats exposed to continuous light: Protection by ACE-inhibition and melatonin."Mediators of Inflammation,Vol. 2014, 2014.
- Suli, Zheng, and Liangdi Xie. "GW25-e0249 Treatment of Myocardial Infarction by Transplantation of Adiponectin Gene-Modified Stromal Vascular Fraction cells from Adipose Tissue."Journal of the American College of Cardiology,Vol. 64, No. 16S, 2014, p. C14.
- Shimamura, Tomoko, Munetaka Ishiyama, and Hiroyuki Ukeda. "Flow injection analysis of angiotensin I-converting enzyme inhibitory activity with enzymatic reactors."Talanta,Vol. 79, No. 4, 2009, pp. 1130-34.
- Domingos-Souza, Gean, et al. "Electrical stimulation of the carotid sinus lowers arterial pressure and improves heart rate variability in L-NAME hypertensive conscious rats."Hypertension Research,Vol. 43, No. 10, 2020, pp. 1057-67.
- Bernátová, Iveta, Ol'Ga Pechánová, and Fedor Simko. "Effect of captopril in L‐NAME‐induced hypertension on the rat myocardium, aorta, brain and kidney."Experimental Physiology,Vol. 84, No. 6, 1999, pp. 1095-105.
- Numaguchi, Kohtaro, et al. "Chronic inhibition of nitric oxide synthesis causes coronary microvascular remodeling in rats."Hypertension,Vol. 26, No. 6, 1995, pp. 957-62.
- Kashiwagi, Minoru, et al. "Locally activated renin-angiotensin system associated with TGF-β1 as a major factor for renal injury induced by chronic inhibition of nitric oxide synthase in rats."Journal of the American Society of Nephrology,Vol. 11, No. 4, 2000, pp. 616-24.
- Ülger, A. Füsun, et al. "Effects of losartan on the renin-angiotensin-aldosterone system and erythrocytosis in patients with chronic obstructive pulmonary disease and systemic hypertension."Clinical Drug Investigation,Vol. 21, No. 5, 2001, pp. 337-43.
- Ragheb, Ahmed, et al. "Attenuated combined action of cyclosporine A and hyperlipidemia on atherogenesis in rabbits by thymoquinone."Evidence-Based Complementary and Alternative Medicine,Vol. 2011, 2011.
- Shakeri, F., M. Khazaei, and M. H. Boskabady. "Cardiovascular effects of Nigella sativa L. and its constituents."Indian Journal of Pharmaceutical Sciences,Vol. 80, No. 6, 2018, pp. 971-83.
